

Which is more accurate: Siphon or a tipping bucket rain gauge?
/
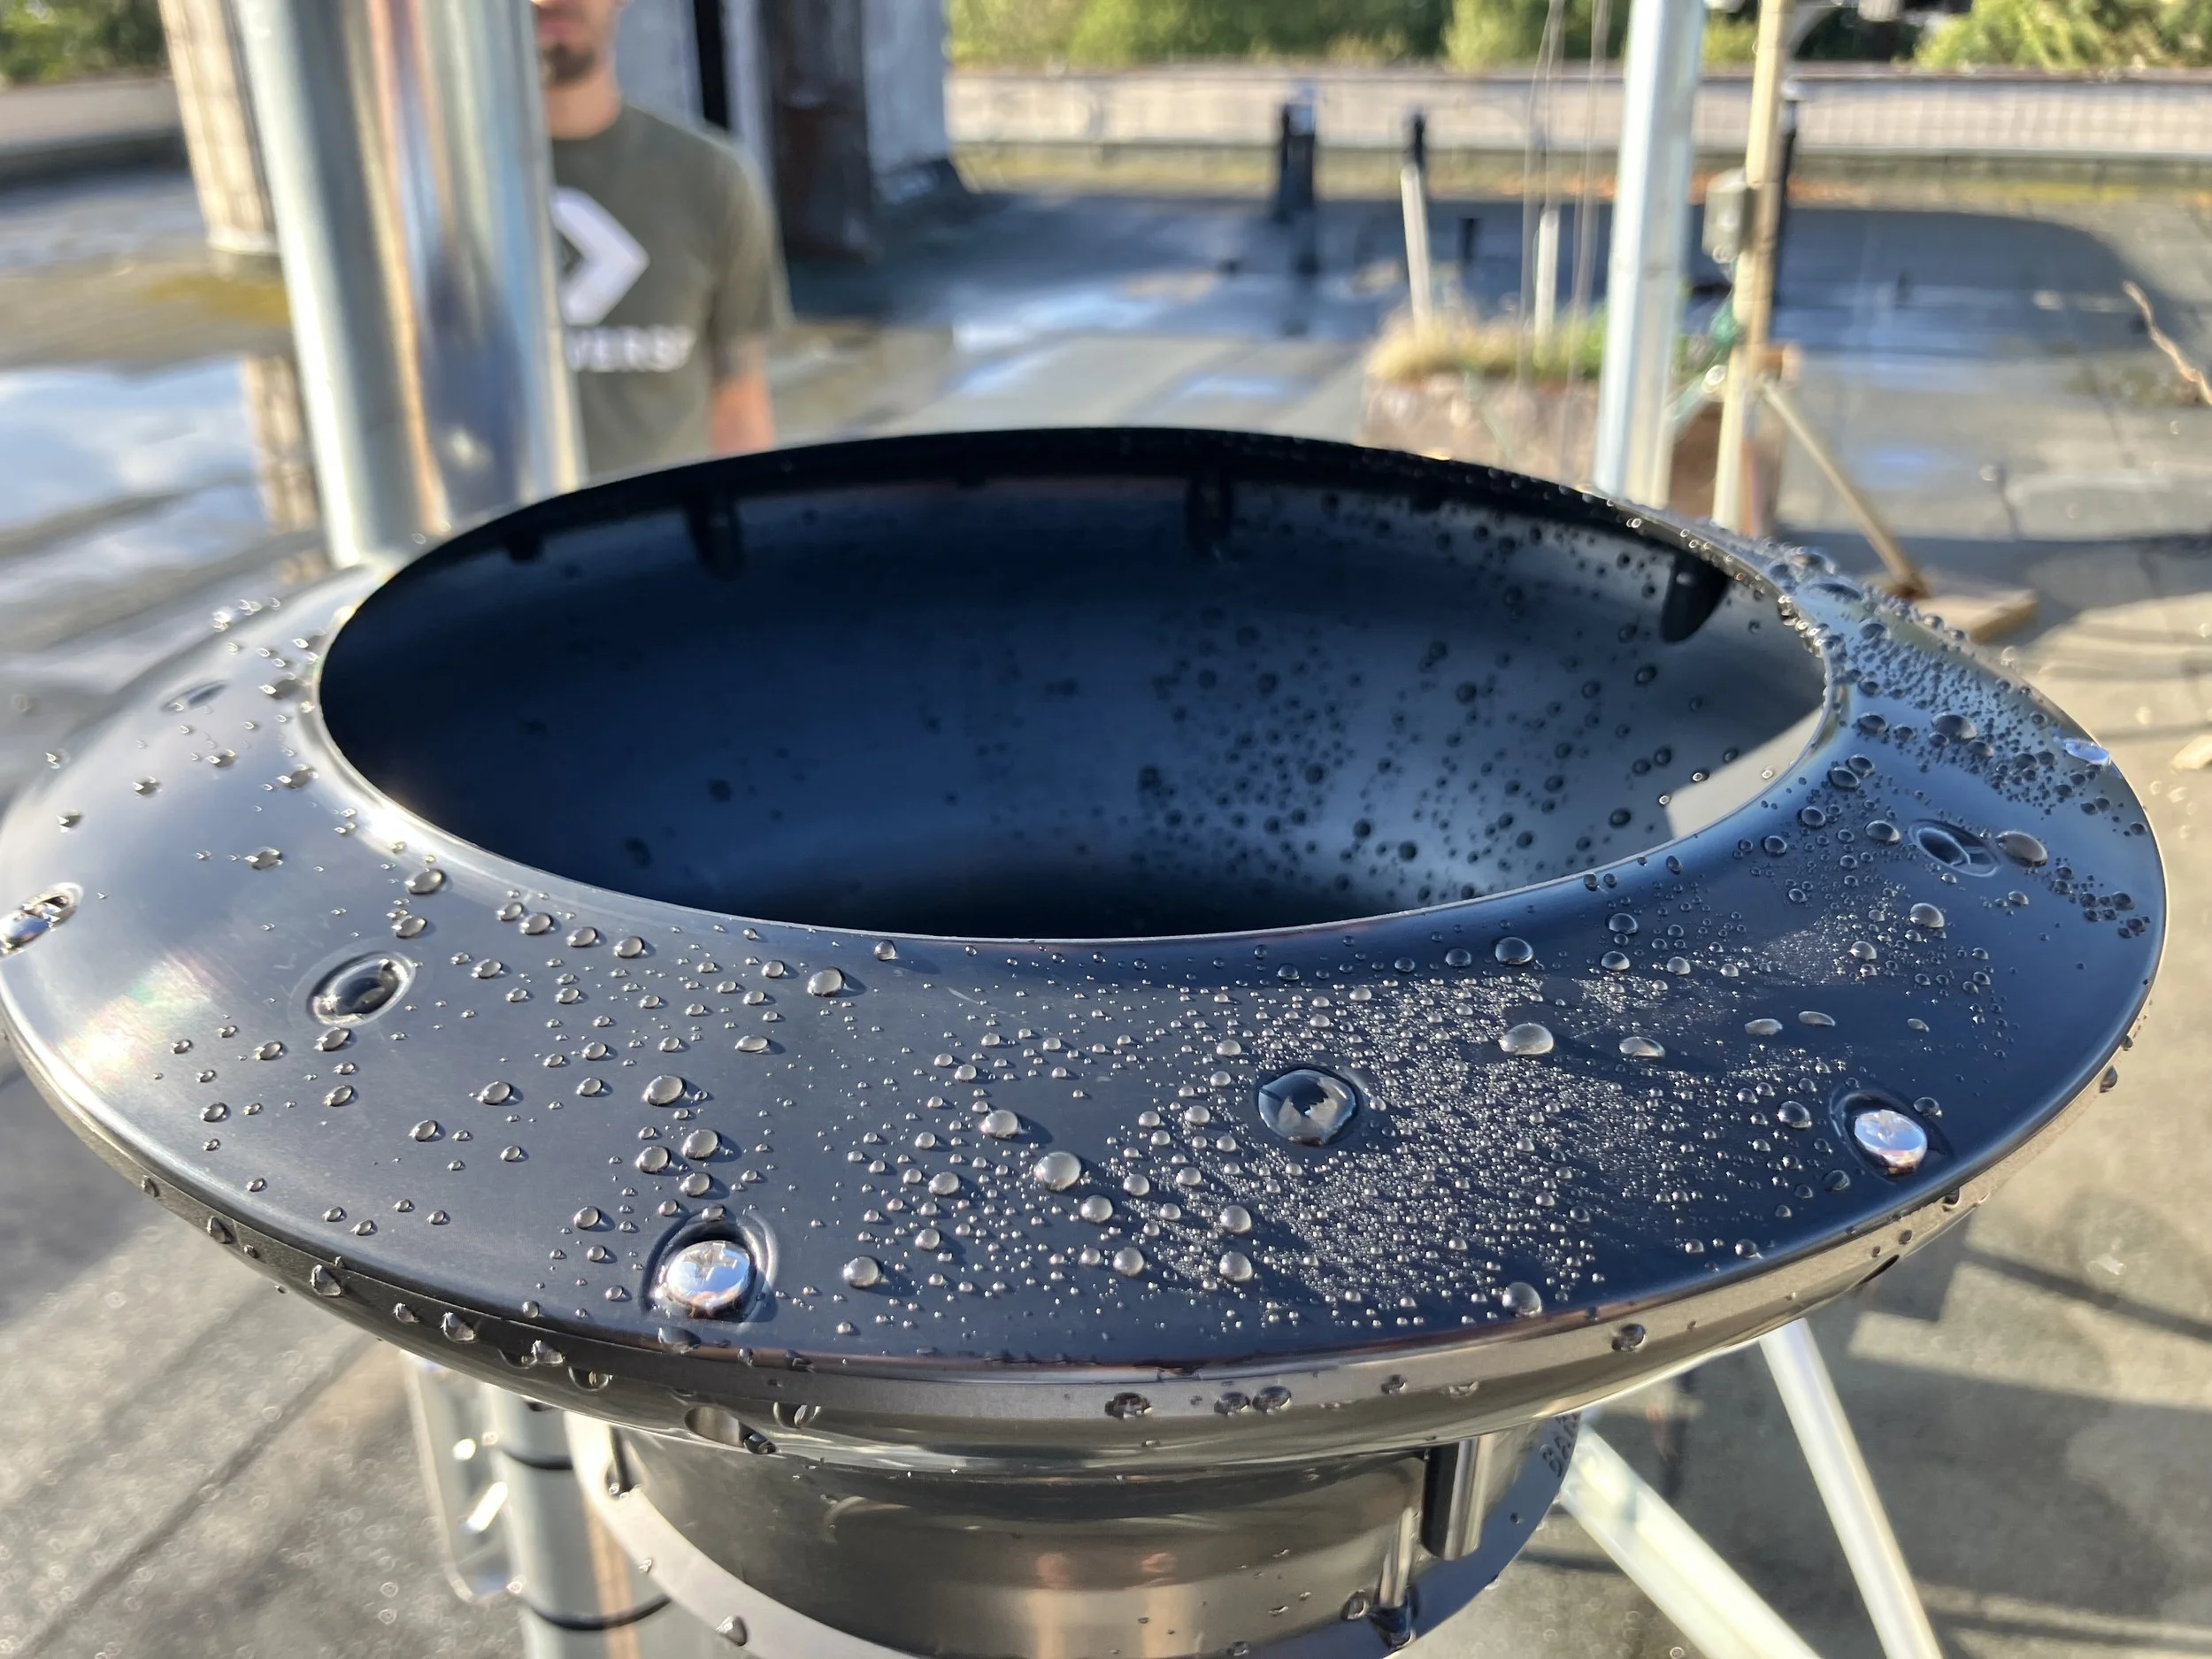
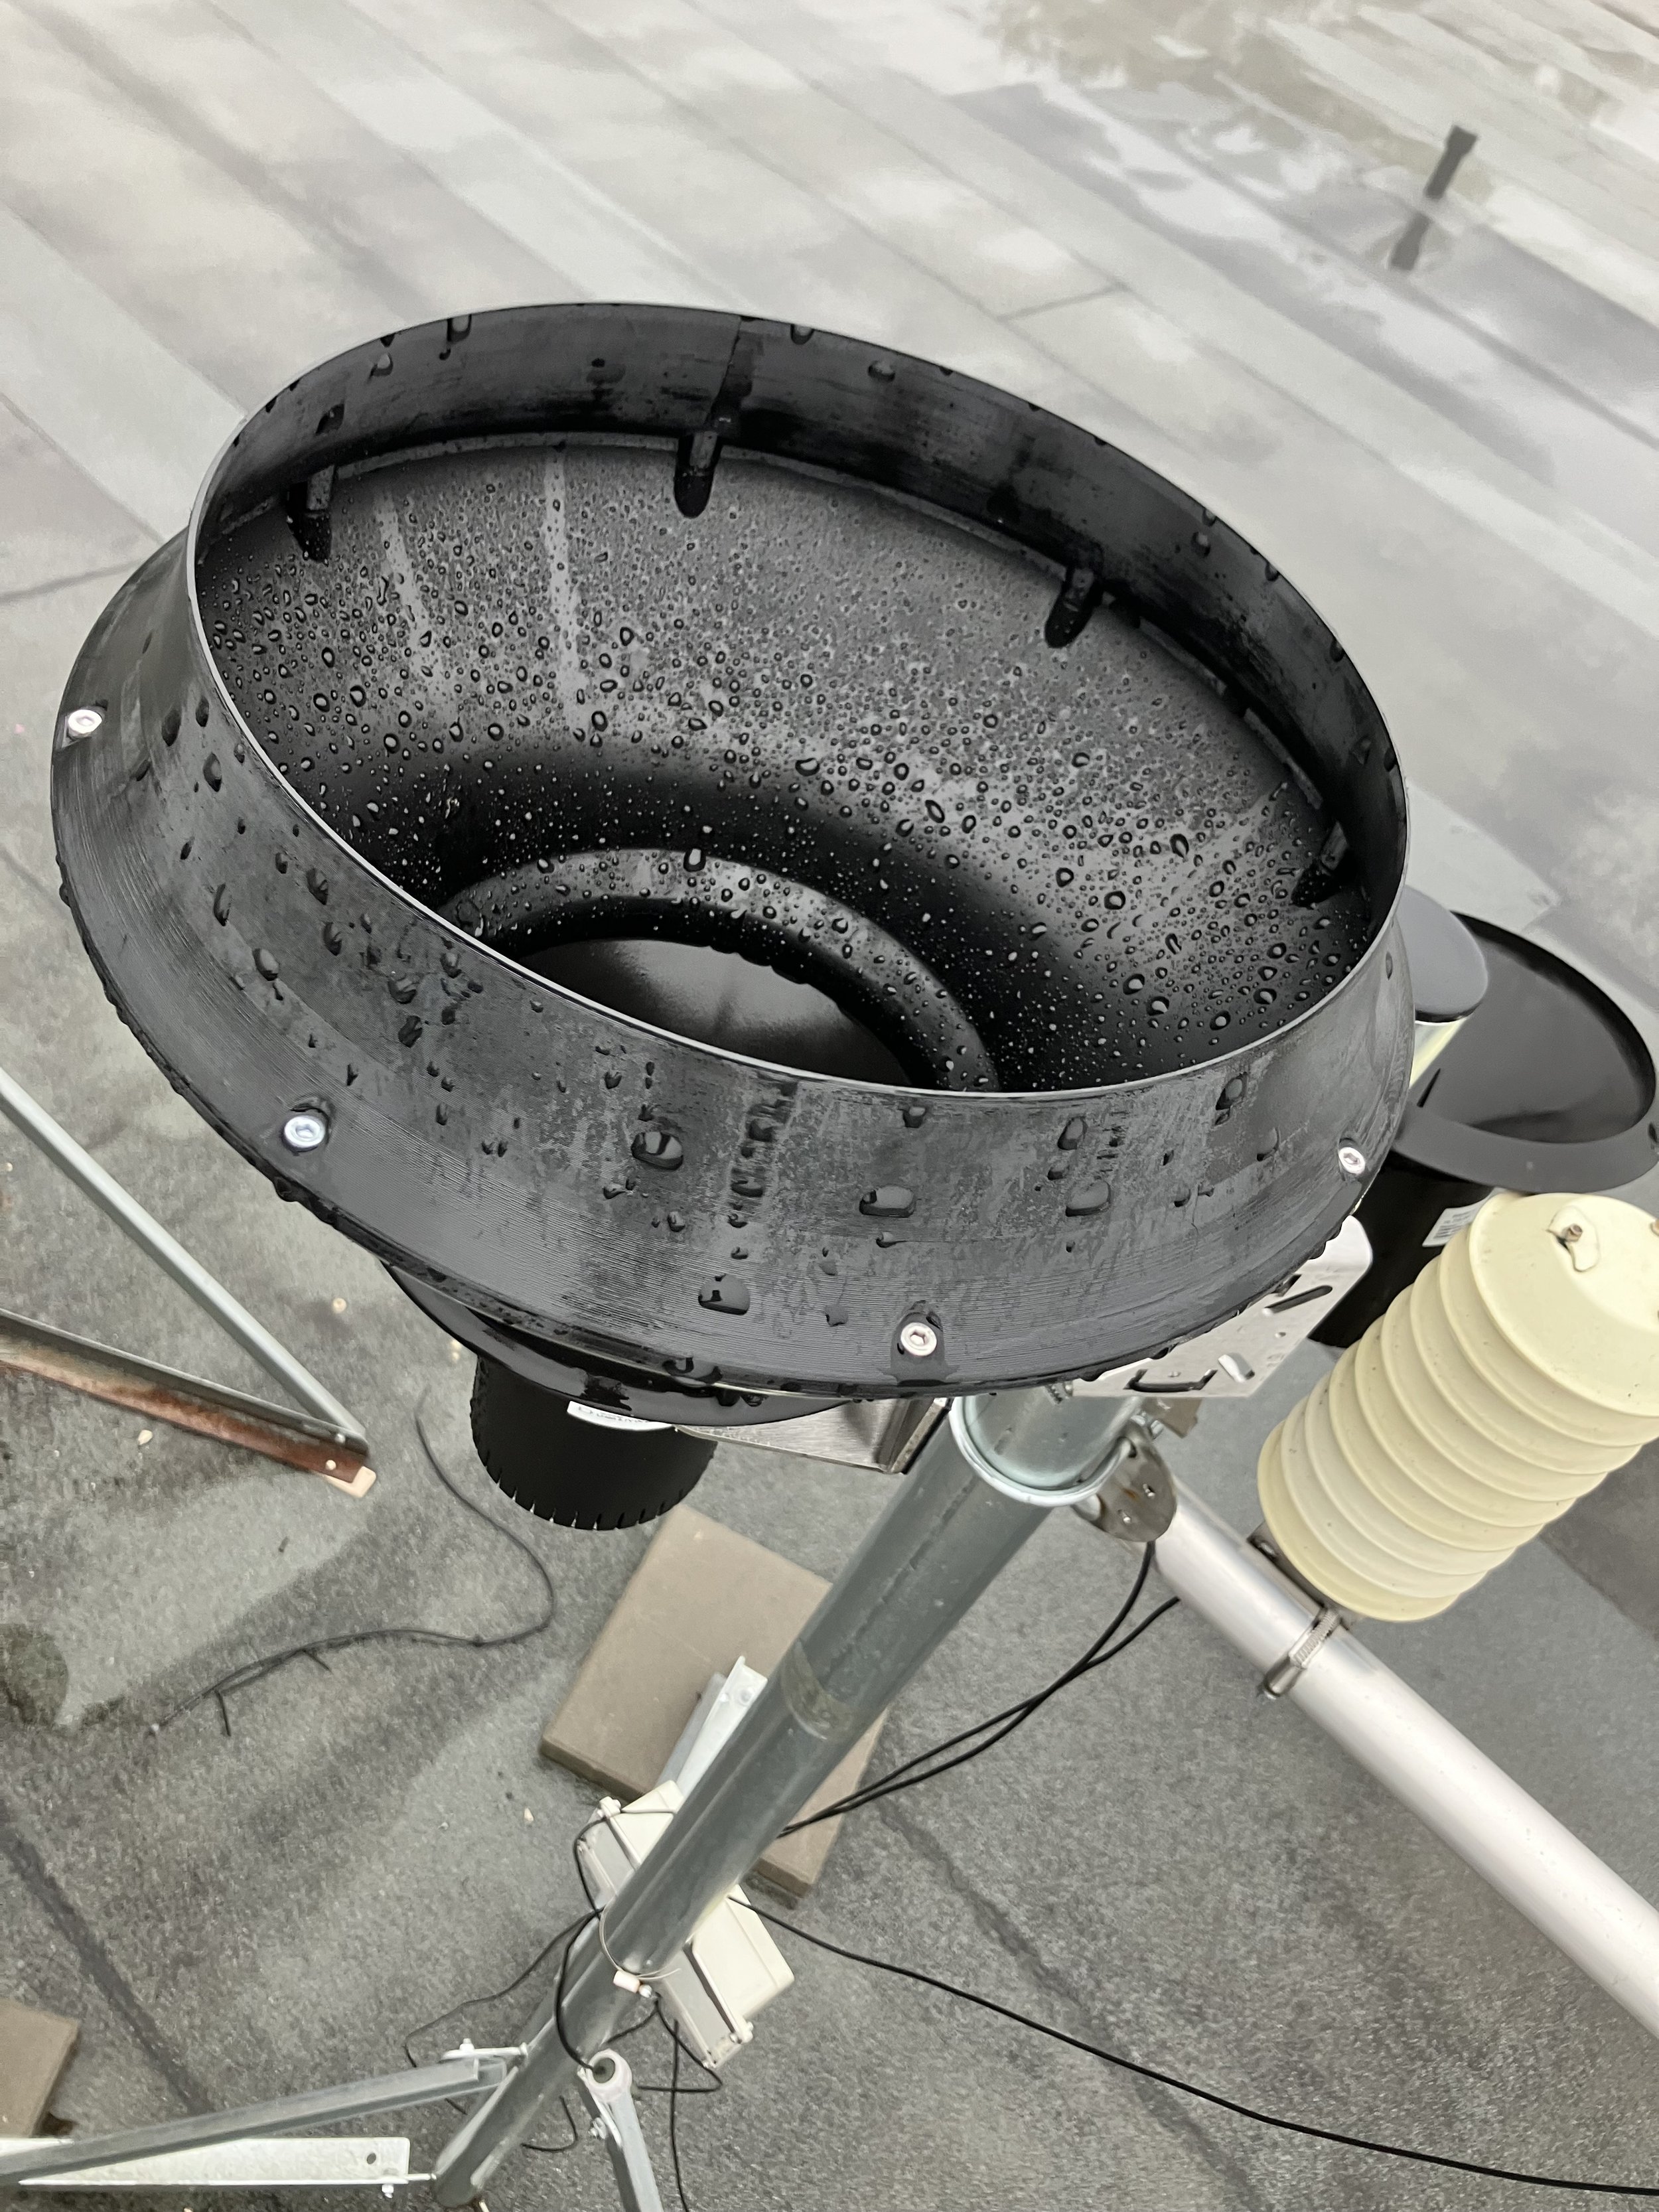
MeteoRain 200 Classic is a 0.2 mm resolution TBGR rain gauge with a compact self cleaning funnel designed as very low maintenance rain intensity gauge for remote locations.
QUESTION: How does a siphon rain gauge reduce rain undercatch vs a tipping bucket?
ANSWER: For short, half-hour rain events like storms with <200mm/hr max ( <100mm/h average) rain fall, a high quality the tipping bucket rain gauge will produce more accurate total rainfall amounts due to not having an extra siphon to fill, which may not get emptied at the end of each storm. For long-duration, high-intensity rain, the siphon rain gauge can be an advantage when both high rain rates and long rain durations are the dominant rainfall patterns. But not all rain gauges are created equal, and this statistical analysis, and mainly the color-coded summary tables below, will surprise even the most avid siphon and TBRG rain gauge enthusiasts.
A siphon rain gauge is a Tipping Bucket Rain Gauge (TBRG) with a siphon installed in the outlet of its funnel to change the way water is dosed into its tipping bucket. When people say a siphon “reduces under‑estimation” in tipping-bucket gauges, they’re mainly referring to dynamic undercatch at high rain intensity rates caused by continued inflow of water into the already full tipping bucket half as it slowly teeters away to expose the opposite empty tipping bucket side to the incoming water. A siphon tries to change the funnel outflow so that it flows at a consistent speed, usually equivalent to 200-300 mm/hr rain rates. Even though the siphon rain gauge's internal tipping bucket produces significant undercatch at these high siphon outflow rates, the stable outflow rate allows the tipping bucket to be calibrated to compensate for this, which is the advantage of siphon rain gauges. But any time something is compensated for, what is it at the expense of?
What one gives up in a siphon rain gauge is the ability to measure rain intensity because the siphon delays water inflow into its tipping bucket and restructures it into doses to produce 200-300mm/hr rain rates, not consistent with the real rain intensity. For example, a drizzle will be represented as 200-300mm/hr rain rate.
The claim that a “siphon reduces under‑estimation” does not automatically include large event-boundary “state” errors which a siphon introduces into the measurements:
Water stored in the siphon chamber when rain ends (water that will eventually evaporate or be counted into the next rain event).
Water left in the siphon gauge’s tipping bucket when rain ends (water that will eventually evaporate or be counted into the next rain event), which is identical to a tipping bucket rain gauge without a siphon.
Dunkerley explicitly notes (i) TBRGs can have start delays and can fail to record the last phases if a bucket remains partially filled, and (ii) siphons add additional timing artefacts because they store water and only release it once a threshold level is reached. (Dunkerley, 2024)
Parameters we can take from manufacturer datasheets/papers
Tipping bucket rain gauge (TBRG) (taken from MeteoRain 200 Pro, MeteoRain 400 Aero, MeteoRain 533 Classic)
Resolution: 0.2 mm MeteoRain 200 Pro (MR200), 0.1 mmMeteoRain 400 Aero (MR400), 0.075 mm MeteoRain 533 Classic (MR533)
Very fast self-emptying mechanism: tipping bucket speed 0.13 s (industry’s fastest to minimize errors)
Field performance spec: ±2%
Starting threshold: “Resolution + 0.07 mm” (and they explicitly discuss wetting/evaporation on funnel surfaces and sieve as part of this starting value)
Barani also states (for the “Pro” update) no-compensation performance up to ~100 mm/h, and maximum deviation −7% without compensation for MeteoRain 200 Pro.
Siphon TBRG rain gauge (taken from TB4 0.2 mm version, arguably one of the most reliable siphon rain gauges)
Resolution (bucket tip size): 0.2 mm/tip
Siphon storage (capacity): 0.4 mm (≈12 mL)
Accuracy spec (depth, steady tests): ±2% up to 250 mm/h; ±3% up to 500 mm/h
The “stored water” problem of the siphon and TBRG’s
This is the cleanest way to compare: start/stop water amounts at the start and end of rain events in mm of rainfall equivalent.
Any TBRG with a 0.2 mm tipping bucket (no siphon)
MeteoRain 400 Aero is a 0.1 mm resolution TBGR rain gauge with a patented super-aerodynamic splash guard funnel designed as a more accurate replacement to weighing rain gauge types.
When it stops raining, the active bucket can be anywhere from:
Tipping bucket partially filled with 0 to 0.2 mm of water but short of tipping.
So the pure tipping bucket rain event end state is:
Worst case: 0.2 mm not yet recorded
Typical (average) case: ~0.1 mm not yet recorded
That’s the MeteoRain 200 situation (no siphon chamber upstream).
Siphon TBRG with a 0.2 mm tipping bucket
Since the siphon chamber and tipping bucket are separate and discrete, they can hold the following amounts of rainwater:
Siphon: 0 to 0.4 mm (because the siphon capacity is 0.4 mm) when the rain stops.
Siphon’s tipping bucket is partially filled with 0 to 0.2 mm of water but short of tipping.
So the siphon rain event end state is:
Worst case not yet recorded: 0.4 + 0.2 = 0.6 mm
Typical (average) not yet recorded: 0.2 + 0.1 = 0.3 mm
So the siphon rain gauge can hold an “extra 0.4 mm of unaccounted for water in the siphon” at the beginning or end of rain events, which can evaporate and is the key difference in total for short storms which are common in the summer or in sub-tropical and tropical regions.
What does the extra unaccounted-for water in the siphon mean for total rain accumulation accuracy in the summer and in tropical/subtropical storms
If a storm lasts only a few minutes, the storm depth is often only a few mm, in which case the 0.3–0.6 mm of “end-state water in the siphon” becomes a large (potential evaporation) error.
Below is a simple illustration for a 5-minute storm (depth = intensity × 5min/60min). This is only the amount that can be unaccounted for when rain ends:
| Intensity (mm/h) | Depth in 5 min (mm) | MeteoRain 200 stop-state (typical / worst) | Siphon TBRG stop-state (typical / worst) |
|---|---|---|---|
| 50 mm/h | 4.17 mm | 0.1 mm (2.4%) / 0.2 mm (4.8%) | 0.3 mm (7.2%) / 0.6 mm (14.4%) |
| 100 mm/h | 8.33 mm | 0.1 mm (1.2%) / 0.2 mm (2.4%) | 0.3 mm (3.6%) / 0.6 mm (7.2%) |
| 200 mm/h | 16.67 mm | 0.1 mm (0.6%) / 0.2 mm (1.2%) | 0.3 mm (1.8%) / 0.6 mm (3.6%) |
So, in the 1–200 mm/h range, the siphon adds an event-end term that is, on average, much larger than the tipping bucket dynamic underestimation of TBRGs.
Why hot-climate evaporation makes this worse
If the storm ends and there’s a long hot gap before the next rain, for the siphon there is more internal stored water to be lost to evaporation.
Short-term intensity and “event segmentation” artefacts
If you care about rain intensity, siphons have another downside: they can distort inter-tip timing because they store water and then dump (dose) it in bursts. Dunkerley shows that siphon-equipped gauges have more variable inter-tip times and that siphon cycling can introduce artefacts and timing differences (even minutes) that do not reflect true rain intensity.
That matters in the tropics because:
storms are short,
peaks are sharp,
and algorithms that split storms based on “no tips for X minutes” can incorrectly split a single storm when a siphon is filling.
Practical comparison for the tropics or continental climate summer heat
MeteoRain 533 Classic is a 0.075 mm resolution TBGR rain gauge with a patented splash guard funnel designed as a more accurate replacement to weighing rain gauge types.
Given these conditions:
storms last a few minutes,
most intensities are 10–200 mm/h,
hot periods make evaporation relevant,
and you care about event totals (start/stop amounts),
MeteoRain 200 (0.2 mm) has a inherent structural advantage:
Smaller event-end stored-water term (0–0.2 mm vs 0–0.6 mm),
Faster tip motion (0.13 s), reducing high-rate dynamic losses,
Siphon is structurally disadvantaged for short, isolated storms because:
It can “unaccount for” up to 0.4 mm or rain in the siphon chamber plus the bucket remainder at the end of a storm,
For short storms with small storm depths, this “unaccounted for” rain becomes a large error of the total rain amount from each storm
In hot climates, that “unaccounted for” water is more likely to turn into evaporation losses or into carryover, distorting the next storm rain accumulation.
Where the siphon can still win:
if you mainly care about longer accumulation periods (hourly/daily totals where carryover cancels),
When rainfall intensity frequently exceeds 300 mm/hr, siphons can improve total rain accumulation accuracy at the expense of rainfall-intensity accuracy compared to the MeteoRain 200. For other tipping bucket rain gauges, the threshold is significantly lower.
Uncompensated MeteoRain gauges vs Siphon TBRG
Each data cell shows two lines: Mean underestimation of rain amount (storm ends at a random point in the last partial fill) and Worst case underestimation of rain amount (storm ends just before the next tip/max remainder). In the difference columns, values are MeteoRain − Siphon TBRG; a negative value indicates that MeteoRain is more accurate by that amount.
| 15-minute events — Combined underestimation Missing rain = dynamic term + end-of-event remainder |
15-minute events — Difference in missing rain: MeteoRain − Siphon TBRG Negative = MeteoRain better (less missing rain) |
||||||||||
|---|---|---|---|---|---|---|---|---|---|---|---|
| Rain rate (mm/h) |
Event depth (mm) |
Siphon TBRG 0.2mm |
MR200 200 cm2 (0.2 mm) |
MR400 400 cm2 (0.1 mm) |
MR533 533 cm2 (0.075 mm) |
Rain rate (mm/h) |
Event depth (mm) |
MeteoRain200 vs Siphon TBRG | MeteoRain400 vs Siphon TBRG | MeteoRain533 vs Siphon | |
| 50 | 12.5 | Typical: 0.339 mm (2.71%) Worst: 0.639 mm (5.11%) |
Typical: 0.100 mm (0.80%) Worst: 0.200 mm (1.60%) |
Typical: 0.195 mm (1.56%) Worst: 0.245 mm (1.96%) |
Typical: 0.296 mm (2.37%) Worst: 0.334 mm (2.67%) |
50 | 12.5 | Typical: -0.239 mm (-1.91%) Worst: -0.439 mm (-3.51%) |
Typical: -0.144 mm (-1.15%) Worst: -0.394 mm (-3.15%) |
Typical: -0.0423 mm (-0.34%) Worst: -0.305 mm (-2.44%) |
|
| 100 | 25.0 | Typical: 0.454 mm (1.81%) Worst: 0.754 mm (3.01%) |
Typical: 0.390 mm (1.56%) Worst: 0.490 mm (1.96%) |
Typical: 0.807 mm (3.23%) Worst: 0.857 mm (3.43%) |
Typical: 0.960 mm (3.84%) Worst: 0.998 mm (3.99%) |
100 | 25.0 | Typical: -0.0637 mm (-0.25%) Worst: -0.264 mm (-1.05%) |
Typical: 0.354 mm (1.42%) Worst: 0.104 mm (0.42%) |
Typical: 0.506 mm (2.03%) Worst: 0.244 mm (0.98%) |
|
| 200 | 50.0 | Typical: 0.911 mm (1.82%) Worst: 1.211 mm (2.42%) |
Typical: 1.615 mm (3.23%) Worst: 1.715 mm (3.43%) |
Typical: 2.560 mm (5.12%) Worst: 2.610 mm (5.22%) |
Typical: 3.208 mm (6.42%) Worst: 3.245 mm (6.49%) |
200 | 50.0 | Typical: 0.704 mm (1.41%) Worst: 0.504 mm (1.01%) |
Typical: 1.649 mm (3.30%) Worst: 1.399 mm (2.80%) |
Typical: 2.297 mm (4.59%) Worst: 2.034 mm (4.07%) |
|
| 30-minute events — Combined underestimation Missing rain = dynamic term + end-of-event remainder |
30-minute events — Difference in missing rain: MeteoRain − Siphon TBRG Negative = MeteoRain better (less missing rain) |
||||||||||
|---|---|---|---|---|---|---|---|---|---|---|---|
| Rain rate (mm/h) |
Event depth (mm) |
Siphon TBRG 0.2mm |
MR200 200 cm2 (0.2 mm) |
MR400 400 cm2 (0.1 mm) |
MR533 533 cm2 (0.075 mm) |
Rain rate (mm/h) |
Event depth (mm) |
MeteoRain200 vs Siphon | MeteoRain400 vs Siphon | MeteoRain533 vs Siphon | |
| 50 | 25.0 | Typical: 0.377 mm (1.51%) Worst: 0.677 mm (2.71%) |
Typical: 0.100 mm (0.40%) Worst: 0.200 mm (0.80%) |
Typical: 0.340 mm (1.36%) Worst: 0.390 mm (1.56%) |
Typical: 0.555 mm (2.22%) Worst: 0.592 mm (2.37%) |
50 | 25.0 | Typical: -0.277 mm (-1.11%) Worst: -0.477 mm (-1.91%) |
Typical: -0.0371 mm (-0.15%) Worst: -0.287 mm (-1.15%) |
Typical: 0.178 mm (0.71%) Worst: -0.0846 mm (-0.34%) |
|
| 100 | 50.0 | Typical: 0.607 mm (1.21%) Worst: 0.907 mm (1.81%) |
Typical: 0.680 mm (1.36%) Worst: 0.780 mm (1.56%) |
Typical: 1.565 mm (3.13%) Worst: 1.615 mm (3.23%) |
Typical: 1.883 mm (3.77%) Worst: 1.920 mm (3.84%) |
100 | 50.0 | Typical: 0.0726 mm (0.15%) Worst: -0.127 mm (-0.25%) |
Typical: 0.958 mm (1.92%) Worst: 0.708 mm (1.42%) |
Typical: 1.275 mm (2.55%) Worst: 1.013 mm (2.03%) |
|
| 200 | 100.0 | Typical: 1.522 mm (1.52%) Worst: 1.822 mm (1.82%) |
Typical: 3.130 mm (3.13%) Worst: 3.230 mm (3.23%) |
Typical: 5.070 mm (5.07%) Worst: 5.120 mm (5.12%) |
Typical: 6.377 mm (6.38%) Worst: 6.415 mm (6.42%) |
200 | 100.0 | Typical: 1.608 mm (1.61%) Worst: 1.408 mm (1.41%) |
Typical: 3.548 mm (3.55%) Worst: 3.298 mm (3.30%) |
Typical: 4.856 mm (4.86%) Worst: 4.593 mm (4.59%) |
|
| 1-hour events — Combined underestimation Missing rain = dynamic term + end-of-event remainder |
1-hour events — Difference in missing rain: MeteoRain − Siphon TBRG Negative = MeteoRain better (less missing rain) |
||||||||||
|---|---|---|---|---|---|---|---|---|---|---|---|
| Rain rate (mm/h) |
Event depth (mm) |
Siphon TBRG 0.2mm |
MR200 200 cm2 (0.2 mm) |
MR400 400 cm2 (0.1 mm) |
MR533 533 cm2 (0.075 mm) |
Rain rate (mm/h) |
Event depth (mm) |
MeteoRain200 vs Siphon | MeteoRain400 vs Siphon | MeteoRain533 vs Siphon | |
| 10 | 10.0 | Typical: 0.306 mm (3.06%) Worst: 0.606 mm (6.06%) |
Typical: 0.100 mm (1.00%) Worst: 0.200 mm (2.00%) |
Typical: 0.0500 mm (0.50%) Worst: 0.100 mm (1.00%) |
Typical: 0.0375 mm (0.38%) Worst: 0.0750 mm (0.75%) |
10 | 10.0 | Typical: -0.206 mm (-2.06%) Worst: -0.406 mm (-4.06%) |
Typical: -0.256 mm (-2.56%) Worst: -0.506 mm (-5.06%) |
Typical: -0.269 mm (-2.69%) Worst: -0.531 mm (-5.31%) |
|
| 25 | 25.0 | Typical: 0.339 mm (1.35%) Worst: 0.639 mm (2.55%) |
Typical: 0.100 mm (0.40%) Worst: 0.200 mm (0.80%) |
Typical: 0.0500 mm (0.20%) Worst: 0.100 mm (0.40%) |
Typical: 0.387 mm (1.55%) Worst: 0.425 mm (1.70%) |
25 | 25.0 | Typical: -0.239 mm (-0.95%) Worst: -0.439 mm (-1.75%) |
Typical: -0.289 mm (-1.15%) Worst: -0.539 mm (-2.15%) |
Typical: 0.0489 mm (0.20%) Worst: -0.214 mm (-0.85%) |
|
| 50 | 50.0 | Typical: 0.454 mm (0.91%) Worst: 0.754 mm (1.51%) |
Typical: 0.100 mm (0.20%) Worst: 0.200 mm (0.40%) |
Typical: 0.630 mm (1.26%) Worst: 0.680 mm (1.36%) |
Typical: 1.073 mm (2.15%) Worst: 1.110 mm (2.22%) |
50 | 50.0 | Typical: -0.354 mm (-0.71%) Worst: -0.554 mm (-1.11%) |
Typical: 0.176 mm (0.35%) Worst: -0.0742 mm (-0.15%) |
Typical: 0.618 mm (1.24%) Worst: 0.356 mm (0.71%) |
|
| 2-hour events — Combined underestimation Missing rain = dynamic term + end-of-event remainder |
2-hour events — Difference in missing rain: MeteoRain − Siphon TBRG Negative = MeteoRain better (less missing rain) |
||||||||||
|---|---|---|---|---|---|---|---|---|---|---|---|
| Rain rate (mm/h) |
Event depth (mm) |
Siphon TBRG 0.2mm |
MR200 200 cm2 (0.2 mm) |
MR400 400 cm2 (0.1 mm) |
MR533 533 cm2 (0.075 mm) |
Rain rate (mm/h) |
Event depth (mm) |
MeteoRain200 vs Siphon | MeteoRain400 vs Siphon | MeteoRain533 vs Siphon | |
| 10 | 20.0 | Typical: 0.312 mm (1.56%) Worst: 0.612 mm (3.06%) |
Typical: 0.100 mm (0.50%) Worst: 0.200 mm (1.00%) |
Typical: 0.0500 mm (0.25%) Worst: 0.100 mm (0.50%) |
Typical: 0.0375 mm (0.19%) Worst: 0.0750 mm (0.38%) |
10 | 20.0 | Typical: -0.212 mm (-1.06%) Worst: -0.412 mm (-2.06%) |
Typical: -0.262 mm (-1.31%) Worst: -0.512 mm (-2.56%) |
Typical: -0.275 mm (-1.37%) Worst: -0.537 mm (-2.69%) |
|
| 25 | 50.0 | Typical: 0.377 mm (0.75%) Worst: 0.677 mm (1.35%) |
Typical: 0.100 mm (0.20%) Worst: 0.200 mm (0.40%) |
Typical: 0.0500 mm (0.10%) Worst: 0.100 mm (0.20%) |
Typical: 0.737 mm (1.48%) Worst: 0.775 mm (1.55%) |
25 | 50.0 | Typical: -0.277 mm (-0.55%) Worst: -0.477 mm (-0.95%) |
Typical: -0.327 mm (-0.65%) Worst: -0.577 mm (-1.15%) |
Typical: 0.360 mm (0.72%) Worst: 0.0978 mm (0.20%) |
|
| 50 | 100.0 | Typical: 0.608 mm (0.61%) Worst: 0.908 mm (0.91%) |
Typical: 0.100 mm (0.10%) Worst: 0.200 mm (0.20%) |
Typical: 1.210 mm (1.21%) Worst: 1.260 mm (1.26%) |
Typical: 2.107 mm (2.11%) Worst: 2.145 mm (2.15%) |
50 | 100.0 | Typical: -0.508 mm (-0.51%) Worst: -0.708 mm (-0.71%) |
Typical: 0.602 mm (0.60%) Worst: 0.352 mm (0.35%) |
Typical: 1.499 mm (1.50%) Worst: 1.237 mm (1.24%) |
|
| 4-hour events — Combined underestimation Missing rain = dynamic term + end-of-event remainder |
4-hour events — Difference in missing rain: MeteoRain − Siphon TBRG Negative = MeteoRain better (less missing rain) |
||||||||||
|---|---|---|---|---|---|---|---|---|---|---|---|
| Rain rate (mm/h) |
Event depth (mm) |
Siphon TBRG 0.2mm |
MR200 200 cm2 (0.2 mm) |
MR400 400 cm2 (0.1 mm) |
MR533 533 cm2 (0.075 mm) |
Rain rate (mm/h) |
Event depth (mm) |
MeteoRain200 vs Siphon | MeteoRain400 vs Siphon | MeteoRain533 vs Siphon | |
| 10 | 40.0 | Typical: 0.325 mm (0.81%) Worst: 0.625 mm (1.56%) |
Typical: 0.100 mm (0.25%) Worst: 0.200 mm (0.50%) |
Typical: 0.0500 mm (0.12%) Worst: 0.100 mm (0.25%) |
Typical: 0.0375 mm (0.09%) Worst: 0.0750 mm (0.19%) |
10 | 40.0 | Typical: -0.225 mm (-0.56%) Worst: -0.425 mm (-1.06%) |
Typical: -0.275 mm (-0.69%) Worst: -0.525 mm (-1.31%) |
Typical: -0.287 mm (-0.72%) Worst: -0.550 mm (-1.37%) |
|
| 25 | 100.0 | Typical: 0.454 mm (0.45%) Worst: 0.754 mm (0.75%) |
Typical: 0.100 mm (0.10%) Worst: 0.200 mm (0.20%) |
Typical: 0.0500 mm (0.05%) Worst: 0.100 mm (0.10%) |
Typical: 1.438 mm (1.44%) Worst: 1.475 mm (1.48%) |
25 | 100.0 | Typical: -0.354 mm (-0.35%) Worst: -0.554 mm (-0.55%) |
Typical: -0.404 mm (-0.40%) Worst: -0.654 mm (-0.65%) |
Typical: 0.983 mm (0.98%) Worst: 0.721 mm (0.72%) |
|
| 50 | 200.0 | Typical: 0.917 mm (0.46%) Worst: 1.217 mm (0.61%) |
Typical: 0.100 mm (0.05%) Worst: 0.200 mm (0.10%) |
Typical: 2.370 mm (1.18%) Worst: 2.420 mm (1.21%) |
Typical: 4.177 mm (2.09%) Worst: 4.215 mm (2.11%) |
50 | 200.0 | Typical: -0.817 mm (-0.41%) Worst: -1.017 mm (-0.51%) |
Typical: 1.453 mm (0.73%) Worst: 1.203 mm (0.60%) |
Typical: 3.261 mm (1.63%) Worst: 2.998 mm (1.50%) |
|
| 8-hour events — Combined underestimation Missing rain = dynamic term + end-of-event remainder |
8-hour events — Difference in missing rain: MeteoRain − Siphon TBRG Negative = MeteoRain better (less missing rain) |
||||||||||
|---|---|---|---|---|---|---|---|---|---|---|---|
| Rain rate (mm/h) |
Event depth (mm) |
Siphon TBRG 0.2mm |
MR200 200 cm2 (0.2 mm) |
MR400 400 cm2 (0.1 mm) |
MR533 533 cm2 (0.075 mm) |
Rain rate (mm/h) |
Event depth (mm) |
MeteoRain200 vs Siphon | MeteoRain400 vs Siphon | MeteoRain533 vs Siphon | |
| 10 | 80.0 | Typical: 0.349 mm (0.44%) Worst: 0.649 mm (0.81%) |
Typical: 0.100 mm (0.12%) Worst: 0.200 mm (0.25%) |
Typical: 0.0500 mm (0.06%) Worst: 0.100 mm (0.12%) |
Typical: 0.0375 mm (0.05%) Worst: 0.0750 mm (0.09%) |
10 | 80.0 | Typical: -0.249 mm (-0.31%) Worst: -0.449 mm (-0.56%) |
Typical: -0.299 mm (-0.37%) Worst: -0.549 mm (-0.69%) |
Typical: -0.312 mm (-0.39%) Worst: -0.574 mm (-0.72%) |
|
| 25 | 200.0 | Typical: 0.609 mm (0.30%) Worst: 0.909 mm (0.45%) |
Typical: 0.100 mm (0.05%) Worst: 0.200 mm (0.10%) |
Typical: 0.0500 mm (0.03%) Worst: 0.100 mm (0.05%) |
Typical: 2.837 mm (1.42%) Worst: 2.875 mm (1.44%) |
25 | 200.0 | Typical: -0.509 mm (-0.25%) Worst: -0.709 mm (-0.35%) |
Typical: -0.559 mm (-0.28%) Worst: -0.809 mm (-0.40%) |
Typical: 2.229 mm (1.11%) Worst: 1.966 mm (0.98%) |
|
| 50 | 400.0 | Typical: 1.533 mm (0.38%) Worst: 1.833 mm (0.46%) |
Typical: 0.100 mm (0.03%) Worst: 0.200 mm (0.05%) |
Typical: 4.690 mm (1.17%) Worst: 4.740 mm (1.18%) |
Typical: 8.317 mm (2.08%) Worst: 8.355 mm (2.09%) |
50 | 400.0 | Typical: -1.433 mm (-0.36%) Worst: -1.633 mm (-0.41%) |
Typical: 3.157 mm (0.79%) Worst: 2.907 mm (0.73%) |
Typical: 6.784 mm (1.70%) Worst: 6.522 mm (1.63%) |
|
Intensity-compensated MeteoRain IoT vs Siphon TBRG
Assumption: MeteoRain IoT intensity compensation removes the rain-rate–dependent dynamic underestimation term (dynamic underestimation set to 0%). MeteoRain missing rain is then only the end-of-event remainder (partial tip). Siphon TBRG values unchanged.
| 15-minute events — Combined underestimation Missing rain = dynamic term + end-of-event remainder |
15-minute events — Difference in missing rain: MeteoRain − Siphon TBRG Negative = MeteoRain better (less missing rain) |
||||||||||
|---|---|---|---|---|---|---|---|---|---|---|---|
| Rain rate (mm/h) |
Event depth (mm) |
Siphon TBRG 0.2mm |
MR200 IoT 200 cm2 (0.2 mm) |
MR400 IoT 400 cm2 (0.1 mm) |
MR533 IoT 533 cm2 (0.075 mm) |
Rain rate (mm/h) |
Event depth (mm) |
MeteoRain200 IoT vs Siphon | MeteoRain400 IoT vs Siphon | MeteoRain533 IoT vs Siphon | |
| 50 | 12.5 | Typical: 0.339 mm (2.71%) Worst: 0.639 mm (5.11%) |
Typical: 0.100 mm (0.80%) Worst: 0.200 mm (1.60%) |
Typical: 0.0500 mm (0.40%) Worst: 0.100 mm (0.80%) |
Typical: 0.0375 mm (0.30%) Worst: 0.0750 mm (0.60%) |
50 | 12.5 | Typical: -0.239 mm (-1.91%) Worst: -0.439 mm (-3.51%) |
Typical: -0.289 mm (-2.31%) Worst: -0.539 mm (-4.31%) |
Typical: -0.301 mm (-2.41%) Worst: -0.564 mm (-4.51%) |
|
| 100 | 25.0 | Typical: 0.454 mm (1.81%) Worst: 0.754 mm (3.01%) |
Typical: 0.100 mm (0.40%) Worst: 0.200 mm (0.80%) |
Typical: 0.0500 mm (0.20%) Worst: 0.100 mm (0.40%) |
Typical: 0.0375 mm (0.15%) Worst: 0.0750 mm (0.30%) |
100 | 25.0 | Typical: -0.354 mm (-1.41%) Worst: -0.554 mm (-2.21%) |
Typical: -0.404 mm (-1.61%) Worst: -0.654 mm (-2.61%) |
Typical: -0.416 mm (-1.66%) Worst: -0.679 mm (-2.71%) |
|
| 200 | 50.0 | Typical: 0.911 mm (1.82%) Worst: 1.211 mm (2.42%) |
Typical: 0.100 mm (0.20%) Worst: 0.200 mm (0.40%) |
Typical: 0.0500 mm (0.10%) Worst: 0.100 mm (0.20%) |
Typical: 0.0375 mm (0.07%) Worst: 0.0750 mm (0.15%) |
200 | 50.0 | Typical: -0.811 mm (-1.62%) Worst: -1.011 mm (-2.02%) |
Typical: -0.861 mm (-1.72%) Worst: -1.111 mm (-2.22%) |
Typical: -0.873 mm (-1.75%) Worst: -1.136 mm (-2.27%) |
|
| 30-minute events — Combined underestimation Missing rain = dynamic term + end-of-event remainder |
30-minute events — Difference in missing rain: MeteoRain − Siphon TBRG Negative = MeteoRain better (less missing rain) |
||||||||||
|---|---|---|---|---|---|---|---|---|---|---|---|
| Rain rate (mm/h) |
Event depth (mm) |
Siphon TBRG 0.2mm |
MR200 IoT 200 cm2 (0.2 mm) |
MR400 IoT 400 cm2 (0.1 mm) |
MR533 IoT 533 cm2 (0.075 mm) |
Rain rate (mm/h) |
Event depth (mm) |
MeteoRain200 IoT vs Siphon | MeteoRain400 IoT vs Siphon | MeteoRain533 IoT vs Siphon | |
| 50 | 25.0 | Typical: 0.377 mm (1.51%) Worst: 0.677 mm (2.71%) |
Typical: 0.100 mm (0.40%) Worst: 0.200 mm (0.80%) |
Typical: 0.0500 mm (0.20%) Worst: 0.100 mm (0.40%) |
Typical: 0.0375 mm (0.15%) Worst: 0.0750 mm (0.30%) |
50 | 25.0 | Typical: -0.277 mm (-1.11%) Worst: -0.477 mm (-1.91%) |
Typical: -0.327 mm (-1.31%) Worst: -0.577 mm (-2.31%) |
Typical: -0.340 mm (-1.36%) Worst: -0.602 mm (-2.41%) |
|
| 100 | 50.0 | Typical: 0.607 mm (1.21%) Worst: 0.907 mm (1.81%) |
Typical: 0.100 mm (0.20%) Worst: 0.200 mm (0.40%) |
Typical: 0.0500 mm (0.10%) Worst: 0.100 mm (0.20%) |
Typical: 0.0375 mm (0.07%) Worst: 0.0750 mm (0.15%) |
100 | 50.0 | Typical: -0.507 mm (-1.01%) Worst: -0.707 mm (-1.41%) |
Typical: -0.557 mm (-1.11%) Worst: -0.807 mm (-1.61%) |
Typical: -0.570 mm (-1.14%) Worst: -0.832 mm (-1.66%) |
|
| 200 | 100.0 | Typical: 1.522 mm (1.52%) Worst: 1.822 mm (1.82%) |
Typical: 0.100 mm (0.10%) Worst: 0.200 mm (0.20%) |
Typical: 0.0500 mm (0.05%) Worst: 0.100 mm (0.10%) |
Typical: 0.0375 mm (0.04%) Worst: 0.0750 mm (0.07%) |
200 | 100.0 | Typical: -1.422 mm (-1.42%) Worst: -1.622 mm (-1.62%) |
Typical: -1.472 mm (-1.47%) Worst: -1.722 mm (-1.72%) |
Typical: -1.484 mm (-1.48%) Worst: -1.747 mm (-1.75%) |
|
| 1-hour events — Combined underestimation Missing rain = dynamic term + end-of-event remainder |
1-hour events — Difference in missing rain: MeteoRain − Siphon TBRG Negative = MeteoRain better (less missing rain) |
||||||||||
|---|---|---|---|---|---|---|---|---|---|---|---|
| Rain rate (mm/h) |
Event depth (mm) |
Siphon TBRG 0.2mm |
MR200 IoT 200 cm2 (0.2 mm) |
MR400 IoT 400 cm2 (0.1 mm) |
MR533 IoT 533 cm2 (0.075 mm) |
Rain rate (mm/h) |
Event depth (mm) |
MeteoRain200 IoT vs Siphon | MeteoRain400 IoT vs Siphon | MeteoRain533 IoT vs Siphon | |
| 10 | 10.0 | Typical: 0.306 mm (3.06%) Worst: 0.606 mm (6.06%) |
Typical: 0.100 mm (1.00%) Worst: 0.200 mm (2.00%) |
Typical: 0.0500 mm (0.50%) Worst: 0.100 mm (1.00%) |
Typical: 0.0375 mm (0.38%) Worst: 0.0750 mm (0.75%) |
10 | 10.0 | Typical: -0.206 mm (-2.06%) Worst: -0.406 mm (-4.06%) |
Typical: -0.256 mm (-2.56%) Worst: -0.506 mm (-5.06%) |
Typical: -0.269 mm (-2.69%) Worst: -0.531 mm (-5.31%) |
|
| 25 | 25.0 | Typical: 0.339 mm (1.35%) Worst: 0.639 mm (2.55%) |
Typical: 0.100 mm (0.40%) Worst: 0.200 mm (0.80%) |
Typical: 0.0500 mm (0.20%) Worst: 0.100 mm (0.40%) |
Typical: 0.0375 mm (0.15%) Worst: 0.0750 mm (0.30%) |
25 | 25.0 | Typical: -0.239 mm (-0.95%) Worst: -0.439 mm (-1.75%) |
Typical: -0.289 mm (-1.15%) Worst: -0.539 mm (-2.15%) |
Typical: -0.301 mm (-1.20%) Worst: -0.564 mm (-2.25%) |
|
| 50 | 50.0 | Typical: 0.454 mm (0.91%) Worst: 0.754 mm (1.51%) |
Typical: 0.100 mm (0.20%) Worst: 0.200 mm (0.40%) |
Typical: 0.0500 mm (0.10%) Worst: 0.100 mm (0.20%) |
Typical: 0.0375 mm (0.07%) Worst: 0.0750 mm (0.15%) |
50 | 50.0 | Typical: -0.354 mm (-0.71%) Worst: -0.554 mm (-1.11%) |
Typical: -0.404 mm (-0.81%) Worst: -0.654 mm (-1.31%) |
Typical: -0.417 mm (-0.83%) Worst: -0.679 mm (-1.36%) |
|
| 2-hour events — Combined underestimation Missing rain = dynamic term + end-of-event remainder |
2-hour events — Difference in missing rain: MeteoRain − Siphon TBRG Negative = MeteoRain better (less missing rain) |
||||||||||
|---|---|---|---|---|---|---|---|---|---|---|---|
| Rain rate (mm/h) |
Event depth (mm) |
Siphon TBRG 0.2mm |
MR200 IoT 200 cm2 (0.2 mm) |
MR400 IoT 400 cm2 (0.1 mm) |
MR533 IoT 533 cm2 (0.075 mm) |
Rain rate (mm/h) |
Event depth (mm) |
MeteoRain200 IoT vs Siphon | MeteoRain400 IoT vs Siphon | MeteoRain533 IoT vs Siphon | |
| 10 | 20.0 | Typical: 0.312 mm (1.56%) Worst: 0.612 mm (3.06%) |
Typical: 0.100 mm (0.50%) Worst: 0.200 mm (1.00%) |
Typical: 0.0500 mm (0.25%) Worst: 0.100 mm (0.50%) |
Typical: 0.0375 mm (0.19%) Worst: 0.0750 mm (0.38%) |
10 | 20.0 | Typical: -0.212 mm (-1.06%) Worst: -0.412 mm (-2.06%) |
Typical: -0.262 mm (-1.31%) Worst: -0.512 mm (-2.56%) |
Typical: -0.275 mm (-1.37%) Worst: -0.537 mm (-2.69%) |
|
| 25 | 50.0 | Typical: 0.377 mm (0.75%) Worst: 0.677 mm (1.35%) |
Typical: 0.100 mm (0.20%) Worst: 0.200 mm (0.40%) |
Typical: 0.0500 mm (0.10%) Worst: 0.100 mm (0.20%) |
Typical: 0.0375 mm (0.07%) Worst: 0.0750 mm (0.15%) |
25 | 50.0 | Typical: -0.277 mm (-0.55%) Worst: -0.477 mm (-0.95%) |
Typical: -0.327 mm (-0.65%) Worst: -0.577 mm (-1.15%) |
Typical: -0.340 mm (-0.68%) Worst: -0.602 mm (-1.20%) |
|
| 50 | 100.0 | Typical: 0.608 mm (0.61%) Worst: 0.908 mm (0.91%) |
Typical: 0.100 mm (0.10%) Worst: 0.200 mm (0.20%) |
Typical: 0.0500 mm (0.05%) Worst: 0.100 mm (0.10%) |
Typical: 0.0375 mm (0.04%) Worst: 0.0750 mm (0.07%) |
50 | 100.0 | Typical: -0.508 mm (-0.51%) Worst: -0.708 mm (-0.71%) |
Typical: -0.558 mm (-0.56%) Worst: -0.808 mm (-0.81%) |
Typical: -0.571 mm (-0.57%) Worst: -0.833 mm (-0.83%) |
|
| 4-hour events — Combined underestimation Missing rain = dynamic term + end-of-event remainder |
4-hour events — Difference in missing rain: MeteoRain − Siphon TBRG Negative = MeteoRain better (less missing rain) |
||||||||||
|---|---|---|---|---|---|---|---|---|---|---|---|
| Rain rate (mm/h) |
Event depth (mm) |
Siphon TBRG 0.2mm |
MR200 IoT 200 cm2 (0.2 mm) |
MR400 IoT 400 cm2 (0.1 mm) |
MR533 IoT 533 cm2 (0.075 mm) |
Rain rate (mm/h) |
Event depth (mm) |
MeteoRain200 IoT vs Siphon | MeteoRain400 IoT vs Siphon | MeteoRain533 IoT vs Siphon | |
| 10 | 40.0 | Typical: 0.325 mm (0.81%) Worst: 0.625 mm (1.56%) |
Typical: 0.100 mm (0.25%) Worst: 0.200 mm (0.50%) |
Typical: 0.0500 mm (0.12%) Worst: 0.100 mm (0.25%) |
Typical: 0.0375 mm (0.09%) Worst: 0.0750 mm (0.19%) |
10 | 40.0 | Typical: -0.225 mm (-0.56%) Worst: -0.425 mm (-1.06%) |
Typical: -0.275 mm (-0.69%) Worst: -0.525 mm (-1.31%) |
Typical: -0.287 mm (-0.72%) Worst: -0.550 mm (-1.37%) |
|
| 25 | 100.0 | Typical: 0.454 mm (0.45%) Worst: 0.754 mm (0.75%) |
Typical: 0.100 mm (0.10%) Worst: 0.200 mm (0.20%) |
Typical: 0.0500 mm (0.05%) Worst: 0.100 mm (0.10%) |
Typical: 0.0375 mm (0.04%) Worst: 0.0750 mm (0.07%) |
25 | 100.0 | Typical: -0.354 mm (-0.35%) Worst: -0.554 mm (-0.55%) |
Typical: -0.404 mm (-0.40%) Worst: -0.654 mm (-0.65%) |
Typical: -0.417 mm (-0.42%) Worst: -0.679 mm (-0.68%) |
|
| 50 | 200.0 | Typical: 0.917 mm (0.46%) Worst: 1.217 mm (0.61%) |
Typical: 0.100 mm (0.05%) Worst: 0.200 mm (0.10%) |
Typical: 0.0500 mm (0.03%) Worst: 0.100 mm (0.05%) |
Typical: 0.0375 mm (0.02%) Worst: 0.0750 mm (0.04%) |
50 | 200.0 | Typical: -0.817 mm (-0.41%) Worst: -1.017 mm (-0.51%) |
Typical: -0.867 mm (-0.43%) Worst: -1.117 mm (-0.56%) |
Typical: -0.879 mm (-0.44%) Worst: -1.142 mm (-0.57%) |
|
| 8-hour events — Combined underestimation Missing rain = dynamic term + end-of-event remainder |
8-hour events — Difference in missing rain: MeteoRain − Siphon TBRG Negative = MeteoRain better (less missing rain) |
||||||||||
|---|---|---|---|---|---|---|---|---|---|---|---|
| Rain rate (mm/h) |
Event depth (mm) |
Siphon TBRG 0.2mm |
MR200 IoT 200 cm2 (0.2 mm) |
MR400 IoT 400 cm2 (0.1 mm) |
MR533 IoT 533 cm2 (0.075 mm) |
Rain rate (mm/h) |
Event depth (mm) |
MeteoRain200 IoT vs Siphon | MeteoRain400 IoT vs Siphon | MeteoRain533 IoT vs Siphon | |
| 10 | 80.0 | Typical: 0.349 mm (0.44%) Worst: 0.649 mm (0.81%) |
Typical: 0.100 mm (0.12%) Worst: 0.200 mm (0.25%) |
Typical: 0.0500 mm (0.06%) Worst: 0.100 mm (0.12%) |
Typical: 0.0375 mm (0.05%) Worst: 0.0750 mm (0.09%) |
10 | 80.0 | Typical: -0.249 mm (-0.31%) Worst: -0.449 mm (-0.56%) |
Typical: -0.299 mm (-0.37%) Worst: -0.549 mm (-0.69%) |
Typical: -0.312 mm (-0.39%) Worst: -0.574 mm (-0.72%) |
|
| 25 | 200.0 | Typical: 0.609 mm (0.30%) Worst: 0.909 mm (0.45%) |
Typical: 0.100 mm (0.05%) Worst: 0.200 mm (0.10%) |
Typical: 0.0500 mm (0.03%) Worst: 0.100 mm (0.05%) |
Typical: 0.0375 mm (0.02%) Worst: 0.0750 mm (0.04%) |
25 | 200.0 | Typical: -0.509 mm (-0.25%) Worst: -0.709 mm (-0.35%) |
Typical: -0.559 mm (-0.28%) Worst: -0.809 mm (-0.40%) |
Typical: -0.571 mm (-0.29%) Worst: -0.834 mm (-0.42%) |
|
| 50 | 400.0 | Typical: 1.533 mm (0.38%) Worst: 1.833 mm (0.46%) |
Typical: 0.100 mm (0.03%) Worst: 0.200 mm (0.05%) |
Typical: 0.0500 mm (0.01%) Worst: 0.100 mm (0.03%) |
Typical: 0.0375 mm (0.01%) Worst: 0.0750 mm (0.02%) |
50 | 400.0 | Typical: -1.433 mm (-0.36%) Worst: -1.633 mm (-0.41%) |
Typical: -1.483 mm (-0.37%) Worst: -1.733 mm (-0.43%) |
Typical: -1.496 mm (-0.37%) Worst: -1.758 mm (-0.44%) |
|
NOTE: Both siphon and syphon spelling are correct, while siphon is the more common spelling, especially in American English. Syphon is the preferred British English.
Citations:
Dunkerley, D. Judging Rainfall Intensity from Inter-Tip Times: Comparing ‘Straight-Through’ and Syphon-Equipped Tipping-Bucket Rain Gauge Performance. Water 2024, 16, 998. https://doi.org/10.3390/w16070998