How to Minimize Dew Point Error: Temperature Accuracy vs. RH Accuracy

Humidity calculations and road-weather accuracy

How to minimize dew-point error: Is air-temperature accuracy or relative-humidity accuracy more important?

Question

How can I minimize calculated dew-point or frost-point error, and should I prioritize air-temperature accuracy or relative-humidity accuracy when choosing a weather sensor?

Answer

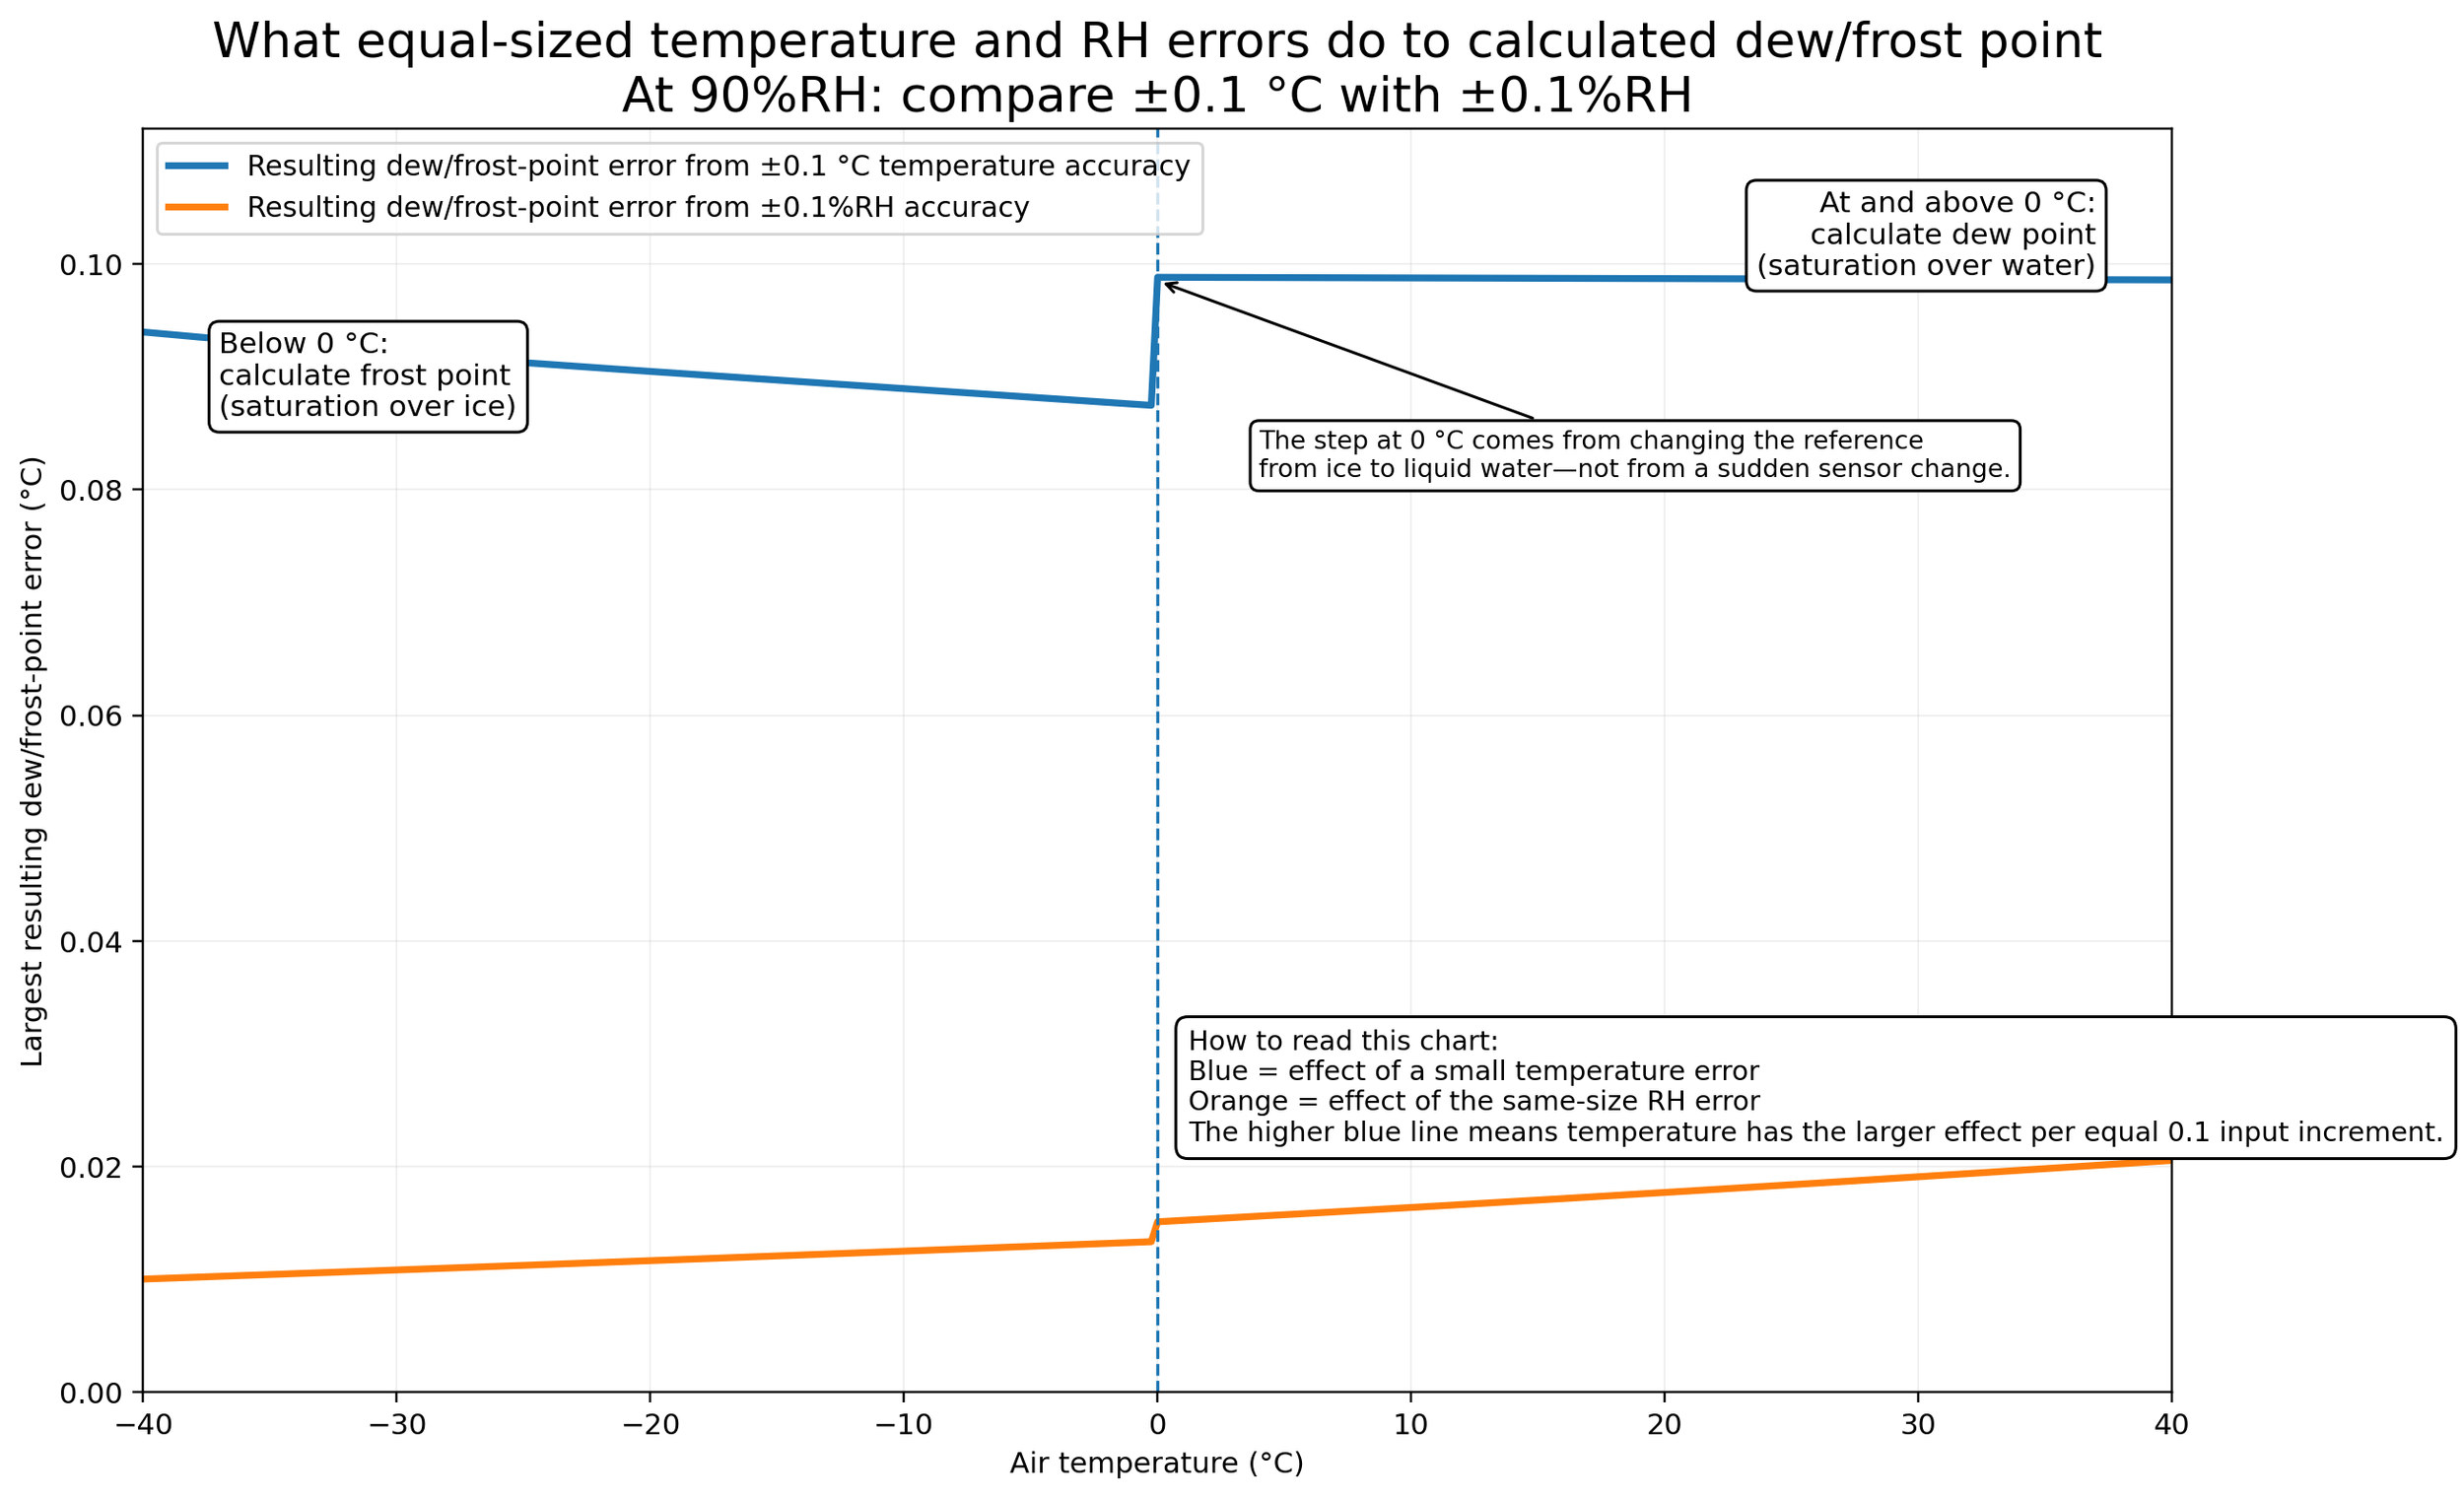
For equal numerical input increments, air-temperature error has the larger effect. At 0 °C and 90% RH, ±0.1 °C produces about 0.0988 °C of dew-point error, while ±0.1 RH percentage point (often written ±0.1% RH) produces about 0.0151 °C—only 0.153 times as much. At −10 °C and 90% RH, the corresponding frost-point errors are about 0.0890 °C and 0.0125 °C—0.141 times as much. In real product specifications, however, RH limits are commonly stated in whole percentage points, so the RH term can still dominate the total uncertainty.

Compare both inputs in equivalent dew/frost-point degrees—and do not carry a room-temperature RH specification into a −10 °C claim unless the manufacturer provides a cold-range equation or calibration evidence.

Below 0 °C this article reports frost point, not dew point, because frost point is the saturation temperature with respect to ice.

Why dew point depends on both temperature and humidity

A combined temperature-humidity probe does not directly measure dew point. It measures air temperature T and relative humidity RH, calculates water-vapor partial pressure, and then finds the saturation temperature corresponding to that vapor pressure.

e = (RH / 100) × es,w(T) Dew point Td: es,w(Td) = e Frost point Tf: es,i(Tf) = e

The plots use the Murphy–Koop saturation-vapor-pressure equations and numerical inversion. RH is treated as referenced to liquid water, which is the usual output convention for meteorological RH sensors.

How sensor error is propagated

For bounded input accuracies ±uT and ±uRH, this article evaluates every positive and negative input-error corner:

E = max |Point(T ± uT, RH ± uRH) − Point(T, RH)|

This is a conservative bounded comparison, not a statistical root-sum-square calculation. Also, ±1% RH is treated as ±1 percentage point: a 90% RH reading becomes 89% to 91% RH.

Which input is more important?

Local dew-point and frost-point sensitivity at 90 percent relative humidity.
Air conditionQuantity∂Point/∂T∂Point/∂RHError from ±0.1 °C TError from ±0.1 RH point
0 °C, 90% RHDew point0.988 °C/°C0.151 °C/point0.0988 °C0.0151 °C
−10 °C, 90% RHFrost point0.889 °C/°C0.125 °C/point0.0890 °C0.0125 °C
0.153×At 0 °C, ±0.1 RH percentage point produces about 15.3% as much dew-point error as ±0.1 °C. Equivalently, the temperature contribution is about 6.54 times larger.
0.141×At −10 °C, ±0.1 RH percentage point produces about 14.1% as much frost-point error as ±0.1 °C. The temperature contribution is about 7.11 times larger.

Two different comparisons must not be mixed: equal-increment sensitivity compares 0.1 °C with 0.1 RH percentage point; a product error budget uses each sensor's full published accuracy limit.

Although equal 0.1-sized increments favor the temperature channel, a ±0.10 °C temperature contribution is matched by only about ±0.652 RH point at 0 °C and ±0.709 RH point at −10 °C. Since practical RH specifications are often ±1 to ±4 points, RH can still dominate the total sensor error budget.

Figure 1. Equal-increment point-temperature sensitivity: ±0.1 °C air-temperature error versus ±0.1 RH percentage-point error. Frost point is used below 0 °C; dew point is used at and above 0 °C. The visible step at 0 °C is the phase-reference change.

Figure 1 uses the same numerical increment for each input. On that basis, temperature error is more influential per 0.1 increment throughout the plotted range, although RH sensitivity increases as air temperature rises. This is a sensitivity comparison—not yet a comparison of full product specifications.

Contour plots: combining temperature and RH accuracy

A real sensor has temperature and humidity error at the same time. The next maps evaluate all four bounded error corners over common commercial ranges: ±0.1 to ±0.5 °C temperature error and ±1 to ±4 RH percentage points. These axes deliberately use typical specification ranges rather than equal numerical increments. Green indicates lower calculated error, red indicates higher calculated error, and each band represents 0.1 °C.

The first map applies to 0 °C and 90% RH, where the calculated quantity is dew point.

Figure 2. Bounded dew-point error at 0 °C and 90% RH.

The contour axes use 0.1 °C horizontal steps but 1 RH percentage-point vertical steps. A one-point RH change is ten times the numerical RH increment used in Figure 1, so vertical movement can produce a larger change even though temperature is more influential per equal 0.1 increment. The maps answer the practical specification question, not the equal-increment sensitivity question.

Below freezing, calculate frost point

At −10 °C and 90% RH, deposition is evaluated against saturation over ice. The next map reports frost-point error using the same sensor-error axes and the same 0.1 °C color-band spacing.

Figure 3. Bounded frost-point error at −10 °C and 90% RH.

The figures show why two statements can both be true: temperature has the larger effect per equal 0.1 input increment, while RH often contributes more to a real product error budget because its specified uncertainty spans whole percentage points. The input to improve first is the one that produces the larger converted dew/frost-point error at the operating condition.

How to minimize dew-point and frost-point error in practice

  1. Convert both published limits into dew/frost-point degrees. Do not compare raw °C and RH percentage points as though their numerical values had the same effect.
  2. Use RH accuracy at the actual temperature and humidity. A single value at 20 or 25 °C is not automatically a −10 °C specification.
  3. Distinguish a published range from an extrapolation. A temperature-dependent equation is stronger evidence than carrying one room-temperature number into winter service.
  4. Still require good air-temperature accuracy near freezing. ±0.1 to ±0.2 °C is materially better than ±0.3 to ±0.5 °C when dew/frost-point depression is small.
  5. Use frost point below 0 °C. Dew point and frost point refer to different saturation surfaces.
  6. Minimize solar heating, self-heating, and thermal lag. T and RH must represent the same air parcel at the same time.
  7. Prevent wetting and contamination. Fog, road spray, salt, rain, and a dirty filter can dominate the laboratory accuracy number.
  8. Calibrate where the decision is made. For winter road weather, use points near 0 °C, −10 °C, and high RH.

Road-weather case study: MeteoTemp vs. HMP45A and HMP155

Case assumptions

  • Air temperature: 0 °C and −10 °C
  • Nominal humidity: 90% RH, referenced to liquid water
  • Output: dew point at 0 °C and frost point at −10 °C
  • Error method: all four bounded T/RH error corners
  • HMP155 temperature output: RS-485

The nominal values are −1.44 °C dew point at 0 °C and −10.09 °C frost point at −10 °C.

Temperature accuracy used

SensorAt 0 °CAt −10 °CBasis
BARANI MeteoTemp±0.100 °C±0.125 °CSupplied band slopes linearly from ±0.10 °C at 0 °C to ±0.20 °C at −40 °C.
Vaisala HMP45A±0.300 °C±0.350 °CRead from the published accuracy graph.
Vaisala HMP155 RS-485±0.176 °C±0.204 °CCalculated from the published RS-485 equation.

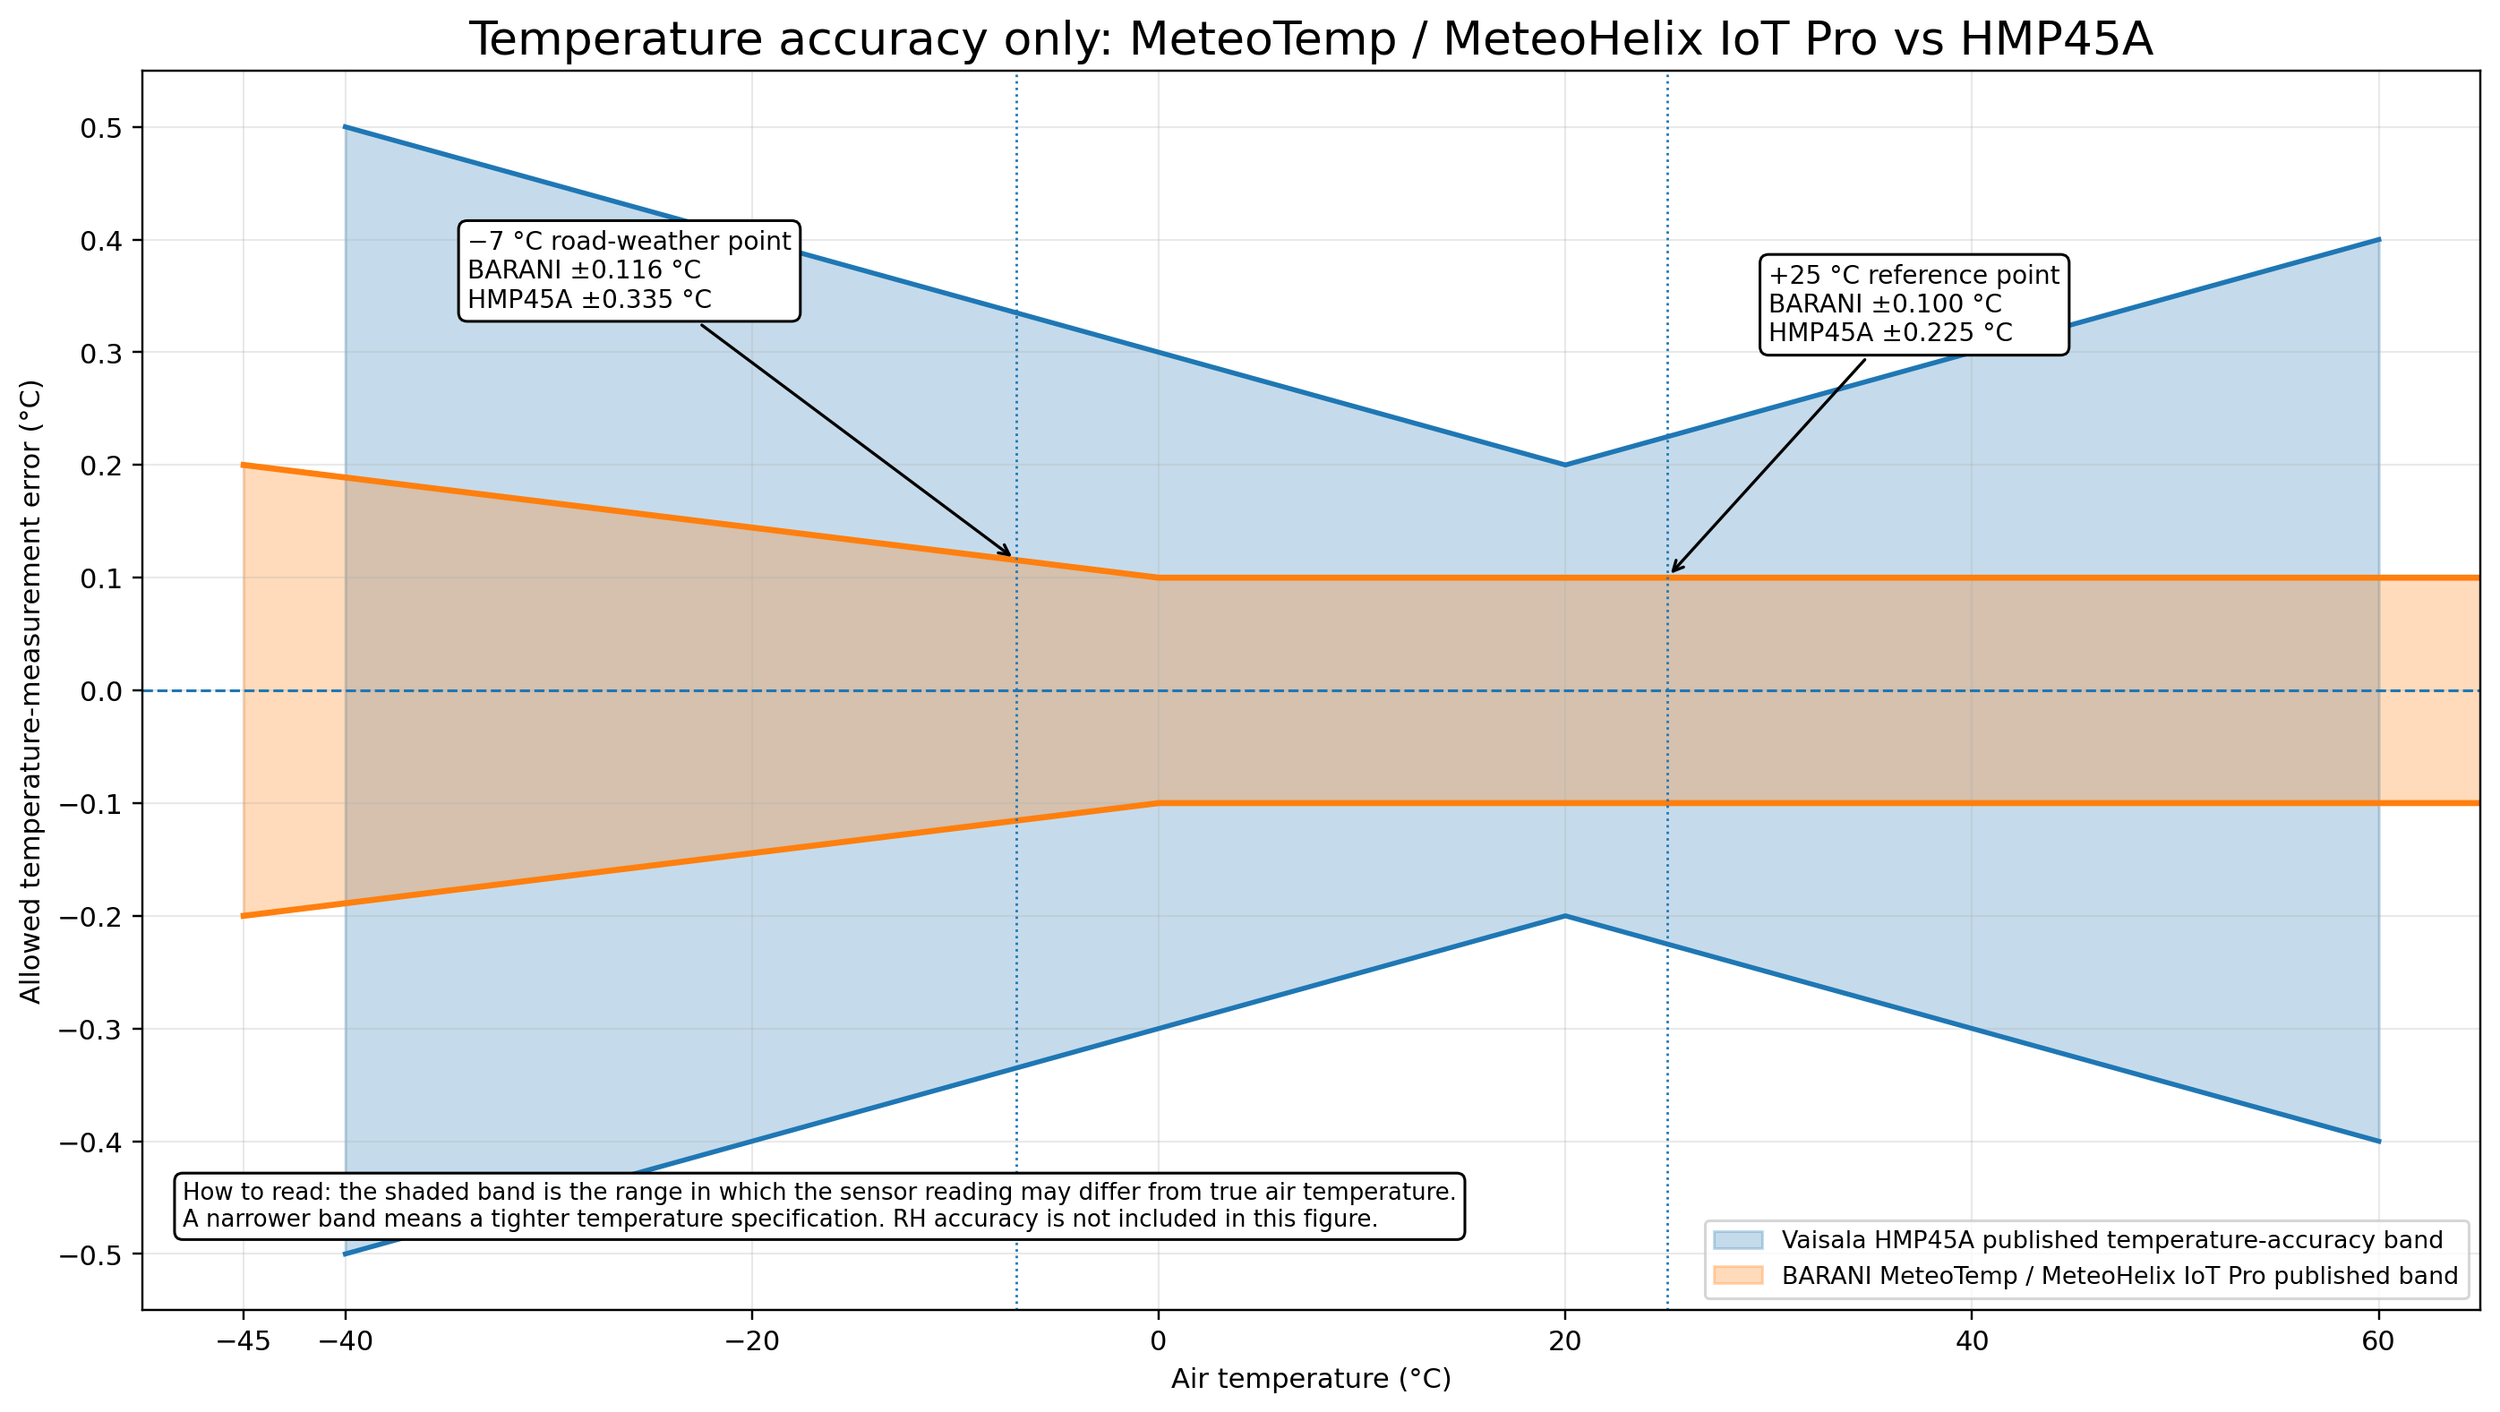
Figure 4. Air-temperature accuracy bands used for the MeteoTemp and legacy HMP45A comparison. The HMP45A curve is transcribed from its operating manual.

Important correction: the MeteoTemp temperature band does not jump from ±0.10 °C to ±0.20 °C immediately below zero. The supplied comparison band transitions linearly to ±0.20 °C at −40 °C, giving ±0.125 °C at −10 °C.

This makes MeteoTemp the strongest temperature channel of the three at both road-weather points. Temperature accuracy alone, however, is not enough to rank dew/frost-point accuracy; the cold-condition RH evidence must be examined separately.

MeteoTemp versus HMP155 temperature accuracy

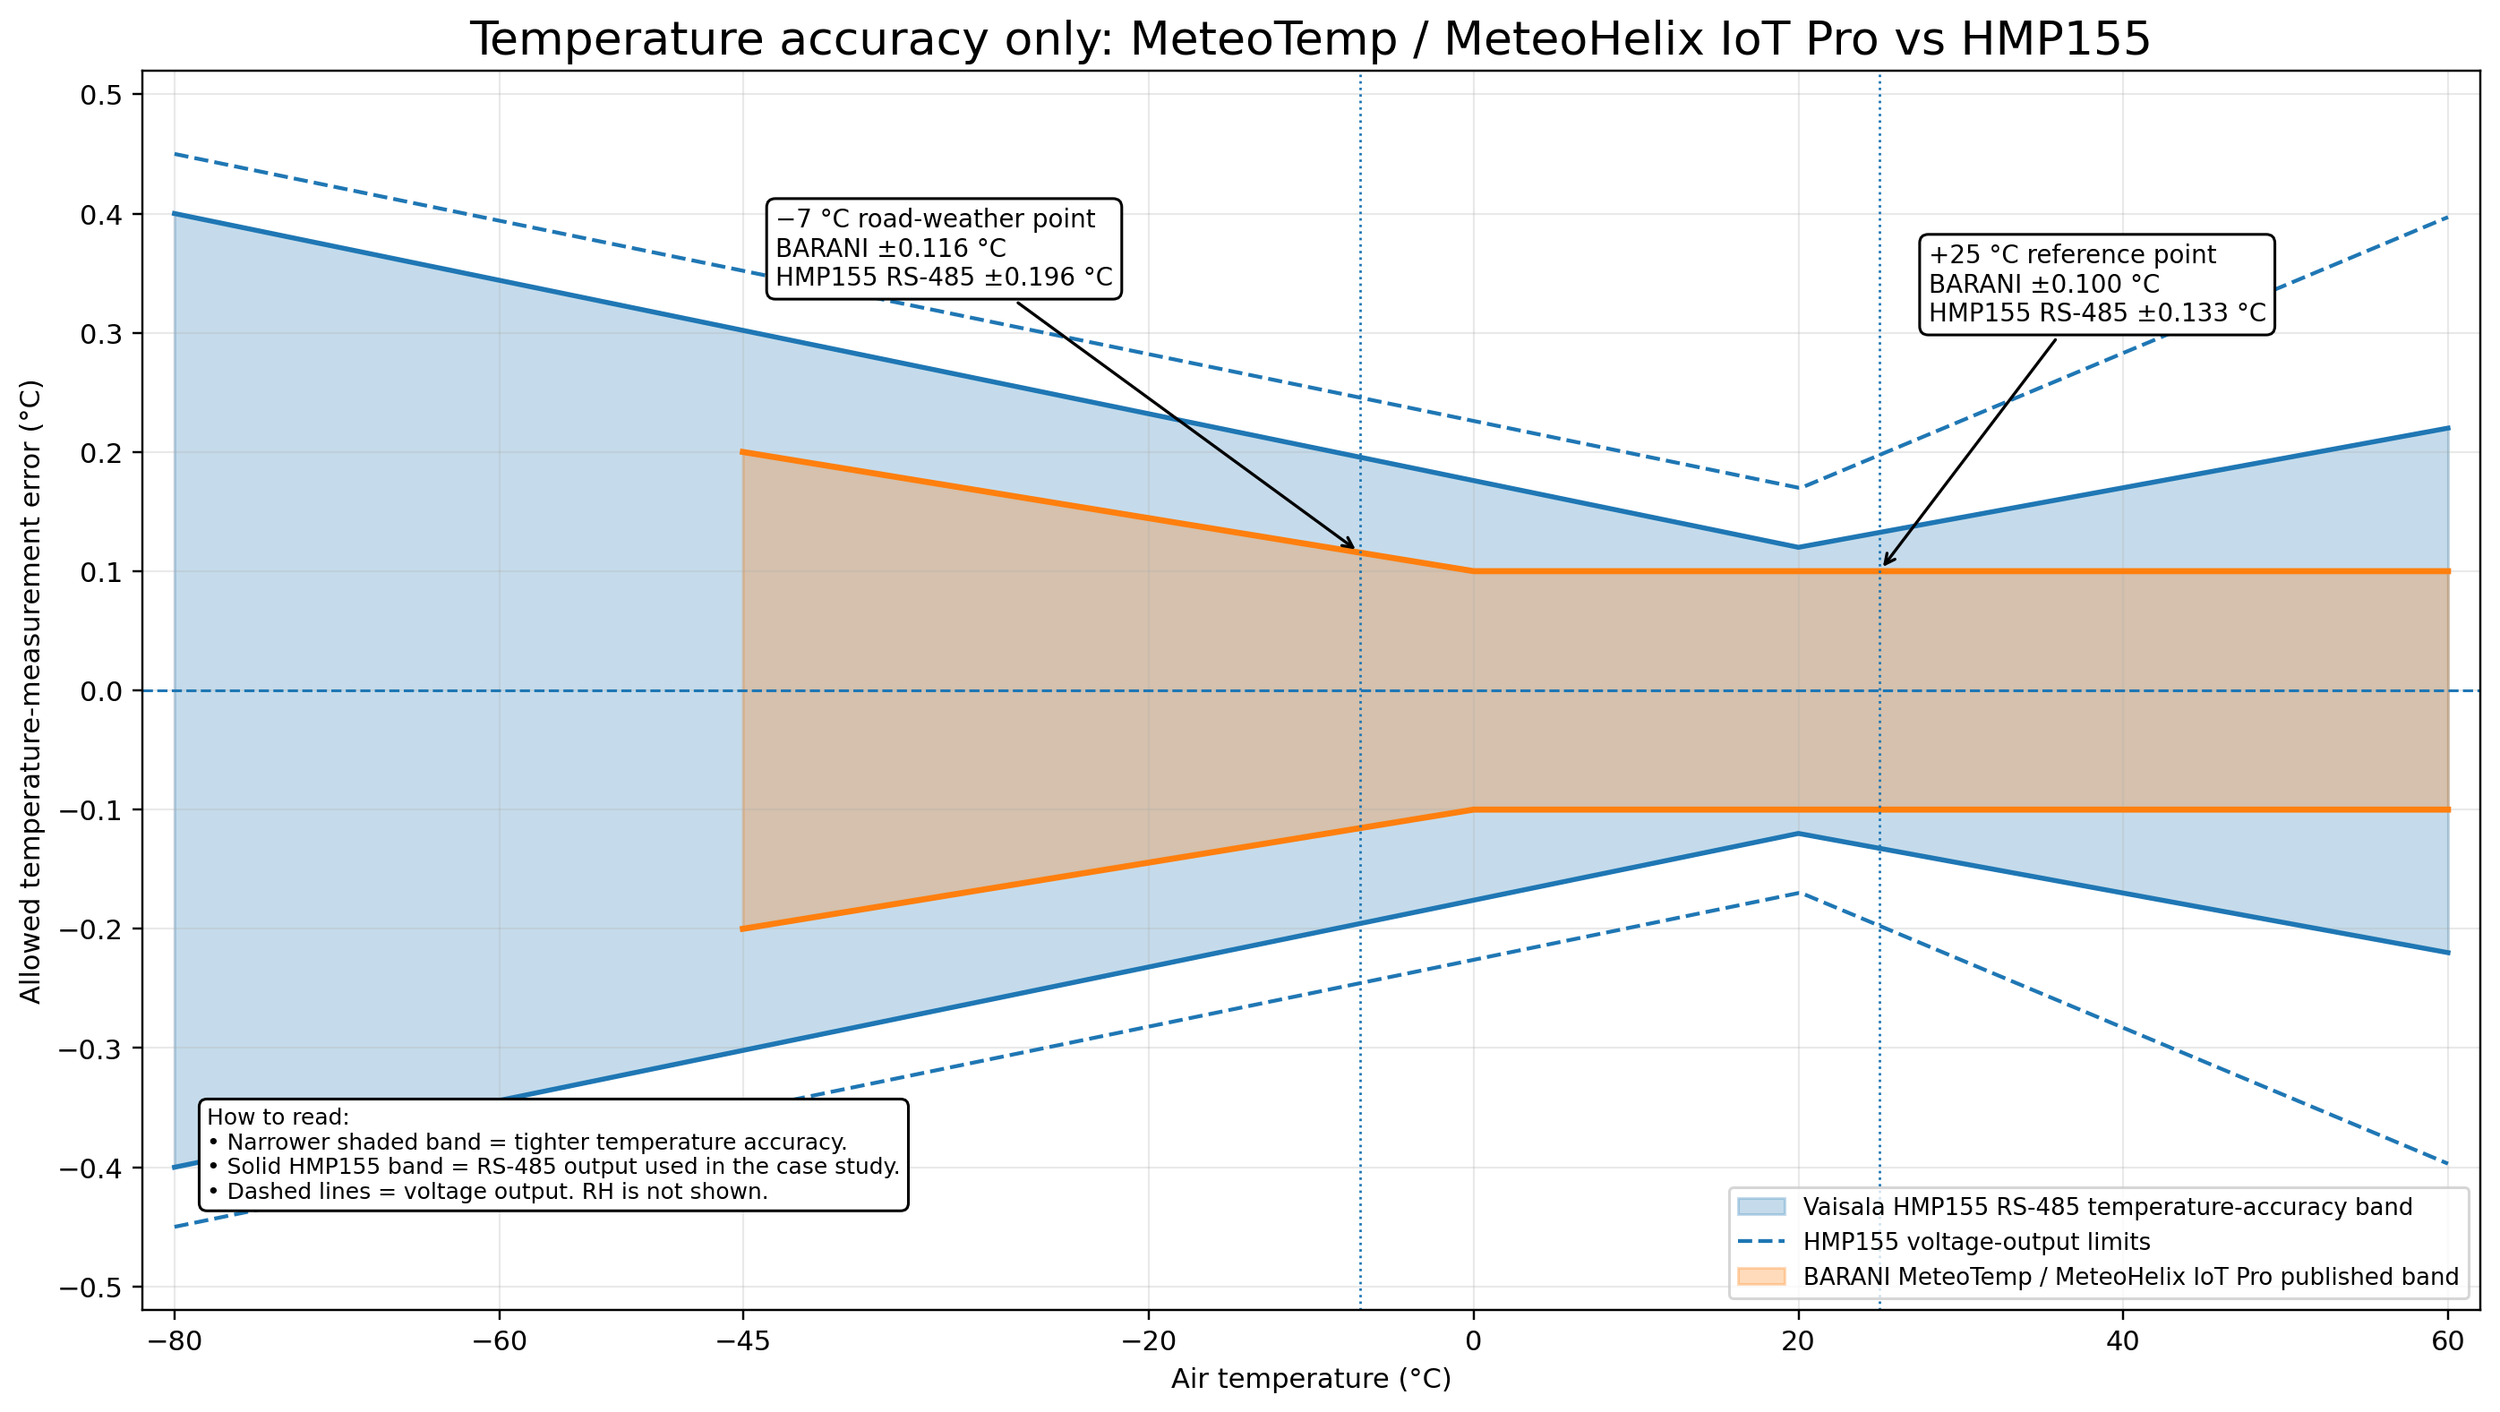
Figure 5 compares that corrected MeteoTemp band with the HMP155 RS-485 and voltage-output temperature equations. The case study uses the RS-485 equation.

Figure 5. Corrected MeteoTemp temperature band over the published HMP155 temperature equations. At −10 °C, the MeteoTemp band is ±0.125 °C.

The decisive difference is cold-condition RH documentation

SensorPublished RH statementRH value at 0 °C, 90% RHRH value at −10 °C, 90% RHStatus
BARANI MeteoTemp±1.5% RH at +25 °CNot directly specifiedNot directly specifiedCold value unavailable
Vaisala HMP45A±1% RH at +20 °C against factory references; temperature dependence ±0.05%RH/°C≈ ±2.00 points≈ ±2.50 pointsDerived
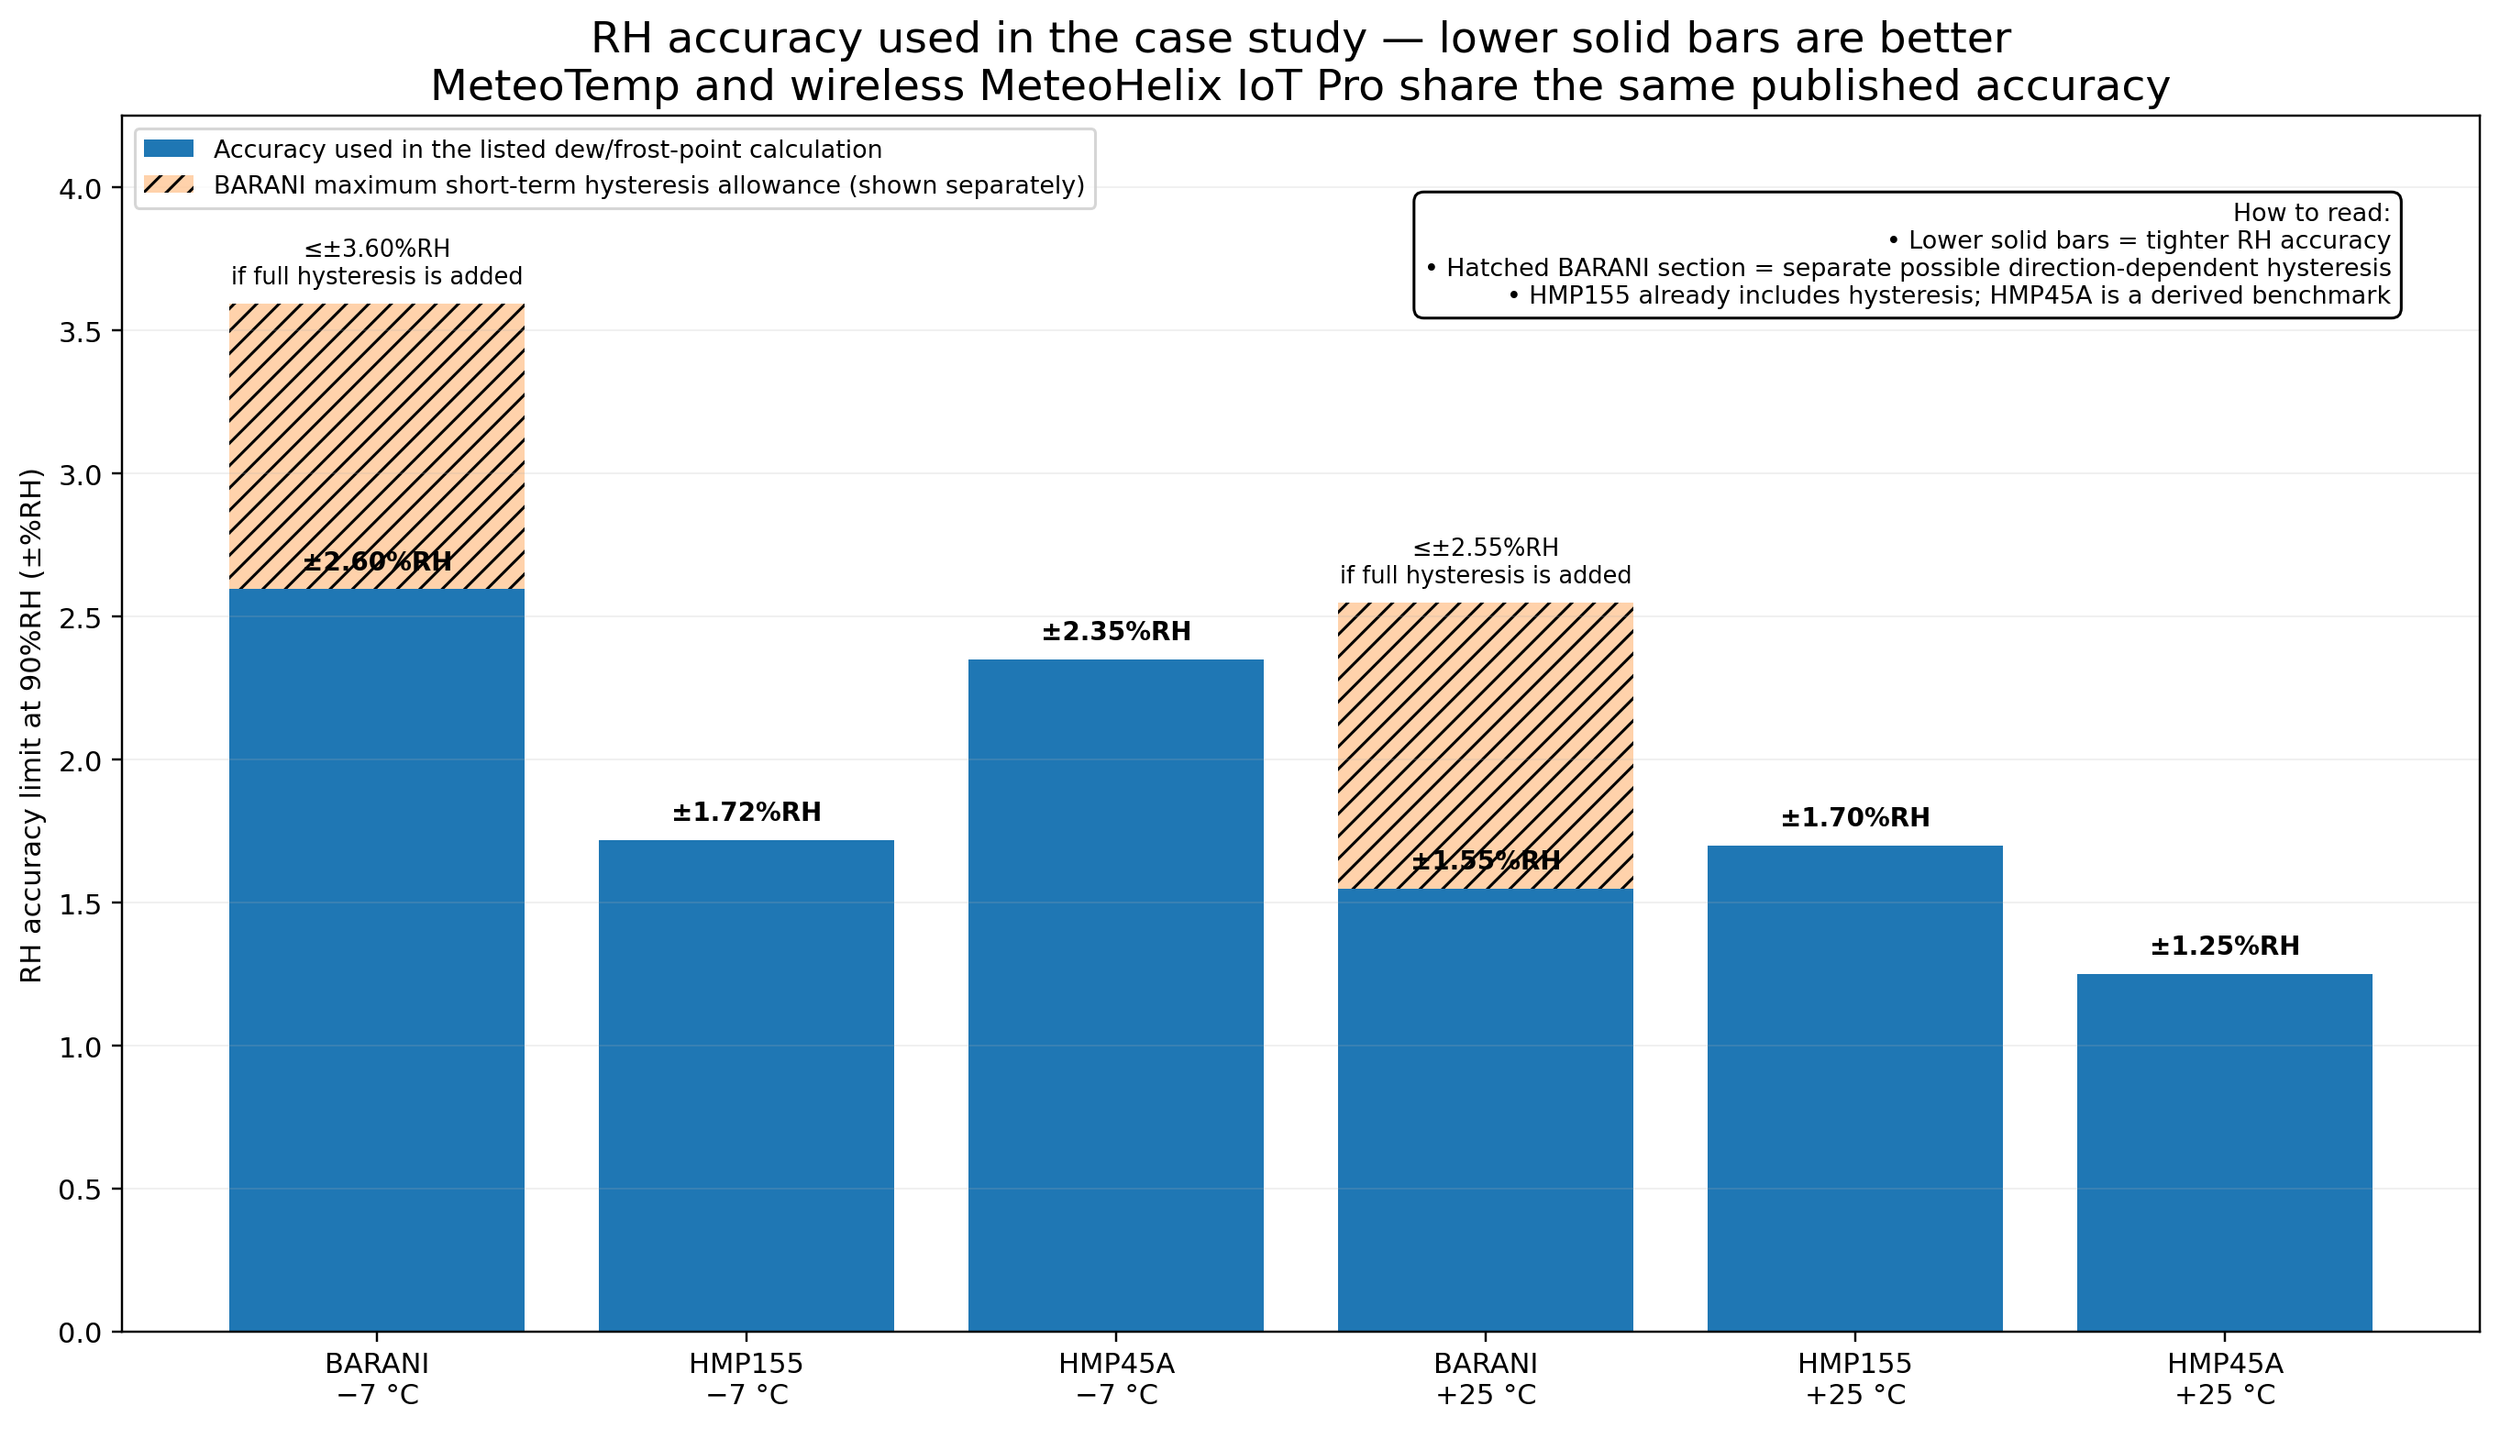
Vaisala HMP155±(1.0 + 0.008 × reading)% RH from −20 to +40 °C±1.72 points±1.72 pointsDirectly specified
For the RH channel in a 0 °C to −10 °C road-weather application, HMP155 is the clear winner in documented accuracy. It supplies a direct cold-range equation; MeteoTemp does not publish a cold RH coefficient, and HMP45A requires a derived interpretation.

HMP155 also publishes a calculated dew/frost-point accuracy of ±0.6 °C at 90–100% RH from −20 to +40 °C. That independent specification is particularly relevant to road-weather service near saturation.

Figure 6. RH accuracy evidence available for the road-weather comparison. HMP45A values are derived from its +20 °C statement and temperature-dependence term; HMP155 is directly specified over the winter range. MeteoTemp has no public 0 °C or −10 °C RH bound.

What can be calculated without overclaiming?

Temperature-only contribution

ConditionMeteoTempHMP45AHMP155 RS-485
0 °C, 90% RH — dew point0.099 °C0.296 °C0.174 °C
−10 °C, 90% RH — frost point0.111 °C0.311 °C0.181 °C

Combined point-temperature result and evidence level

ConditionSensorRH value usedCombined bounded errorInterpretation
0 °C, 90% RHBARANI MeteoTempNot specified at 0 °CDo not claim a full dew-point bound from the +25 °C RH figure alone.
0 °C, 90% RHVaisala HMP45A≈ ±2.00 pp≈ 0.601 °CDerived scenario
0 °C, 90% RHVaisala HMP155 RS-485±1.72 pp0.436 °CPublished-range inputs
−10 °C, 90% RHBARANI MeteoTempNot specified at −10 °CTemperature performance is known; total frost-point accuracy needs cold RH evidence.
−10 °C, 90% RHVaisala HMP45A≈ ±2.50 pp≈ 0.627 °CDerived scenario
−10 °C, 90% RHVaisala HMP155 RS-485±1.72 pp0.398 °CPublished-range inputs

Fair comparison rule: a calculated number is only as defensible as the weakest input specification. HMP155 is the only sensor in this three-way comparison with a complete public RH accuracy expression that directly includes −10 °C.

What RH accuracy would MeteoTemp need?

Because MeteoTemp has the best temperature channel, the unknown RH term can be expressed as a break-even requirement rather than guessed. The table below gives the maximum MeteoTemp RH uncertainty that would still equal each modeled benchmark:

ConditionMeteoTemp RH needed to match HMP155 totalMeteoTemp RH needed to match HMP45A total
0 °C, 90% RH≈ ±2.21 points or better≈ ±3.27 points or better
−10 °C, 90% RH≈ ±2.27 points or better≈ ±4.05 points or better

These are break-even thresholds, not claims about MeteoTemp's cold RH accuracy. The HMP155 threshold uses published-range inputs. The HMP45A threshold is a secondary modeled benchmark because its cold RH value is derived from its +20 °C statement and stated temperature dependence. Product-level cold-chamber data are still needed to establish the actual BARANI result.

Figure 7. BARANI frost-point error at −10 °C as a function of its unknown cold-RH accuracy. The two intersections are break-even requirements: approximately ±2.27 RH points to match the modeled HMP155 total and ±4.05 RH points to match the modeled HMP45A total. No BARANI cold-RH accuracy is assumed.

What the case study shows

  • Temperature channel: MeteoTemp is best at both 0 °C and −10 °C. Its plotted band is ±0.125 °C at −10 °C—not an abrupt ±0.20 °C step below zero.
  • RH channel: HMP155 is strongest in documented winter performance. At 90% RH it is directly specified at ±1.72 points from −20 to +40 °C.
  • HMP45A: its derived RH limit is approximately ±2.00 points at 0 °C and ±2.50 points at −10 °C, so HMP155 has the lower RH contribution in this model.
  • Overall at −10 °C: HMP155 is the only one of the three for which a complete public-spec frost-point uncertainty can be calculated without assigning an unreported BARANI cold-RH value.
  • BARANI break-even result: at −10 °C and 90% RH, its cold-RH accuracy must remain within approximately ±2.27 points to match or beat the modeled HMP155 total, and within approximately ±4.05 points to match or beat the modeled HMP45A total.

Road-weather limitations that matter in the field

This comparison isolates sensor specifications. A roadside station also includes radiation-shield error, wetting, salt contamination, response mismatch, calibration drift, data-acquisition error, and spatial differences between air and pavement.

A dew/frost-point calculation is not a substitute for a pavement-temperature sensor. Road icing depends on pavement temperature, precipitation, treatment, traffic, radiation, and local energy balance.

Bottom line

Where a cold-RH specification is unavailable, do not invent one. Use the known temperature accuracy to calculate the RH break-even threshold required to equal a documented benchmark.
  • Do not extrapolate a +20 or +25 °C RH headline into −10 °C without evidence.
  • Use frost point below freezing.
  • For BARANI, verify whether cold-RH accuracy remains within the calculated break-even limits before making a product-level frost-point claim.
  • Control wetting, self-heating, solar loading, response time, and calibration—not only the sensing-element specification.

References

  1. Murphy, D. M. and Koop, T. (2005), Review of the vapour pressures of ice and supercooled water for atmospheric applications. DOI 10.1256/qj.04.94.
  2. BARANI DESIGN, MeteoTemp RH+T+Pressure Datasheet, release 2024/10. Open datasheet.
  3. Vaisala, HMP45A/D User Guide U274EN-1.2. Open user guide.
  4. Vaisala, HMP155 User Guide — specifications. Open specifications.
  5. Vaisala, Dew point / frost point temperature selection. Open technical note.

Calculation note: all displayed values were calculated without intermediate rounding. No BARANI cold-RH value is inserted into the model. Instead, the article solves for the maximum RH uncertainty that would equal each benchmark total. HMP45A cold RH values and its resulting benchmark remain explicitly labeled as derived.