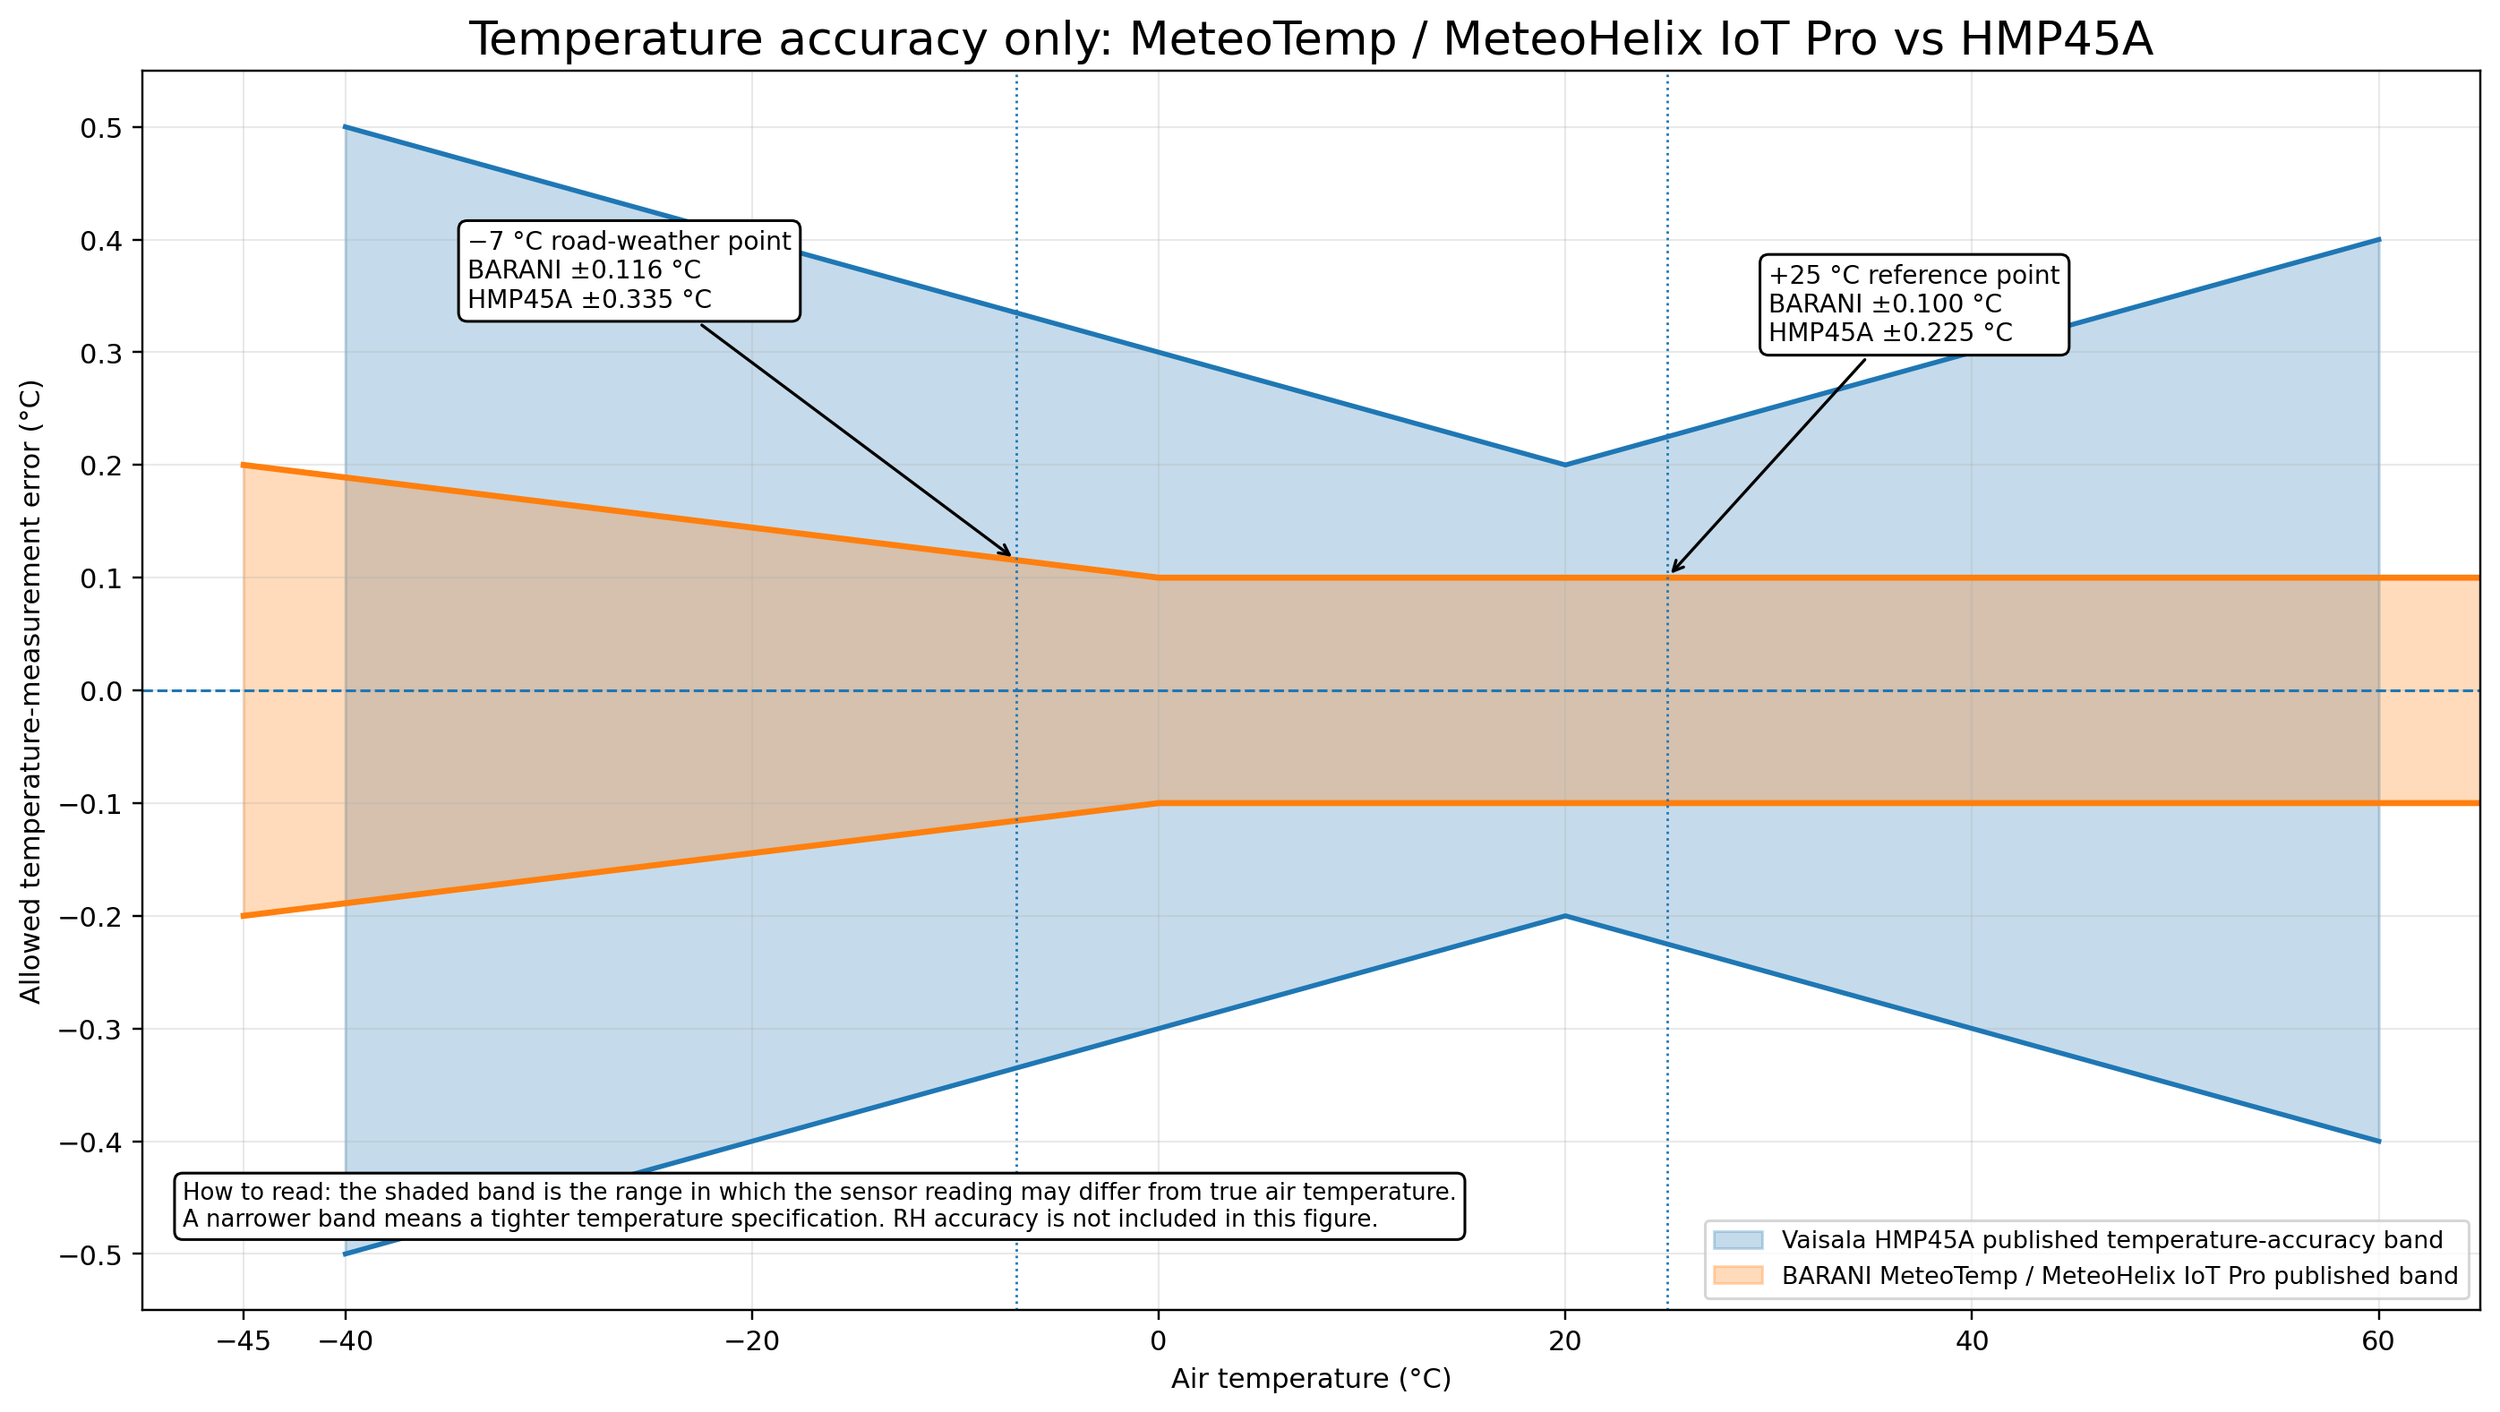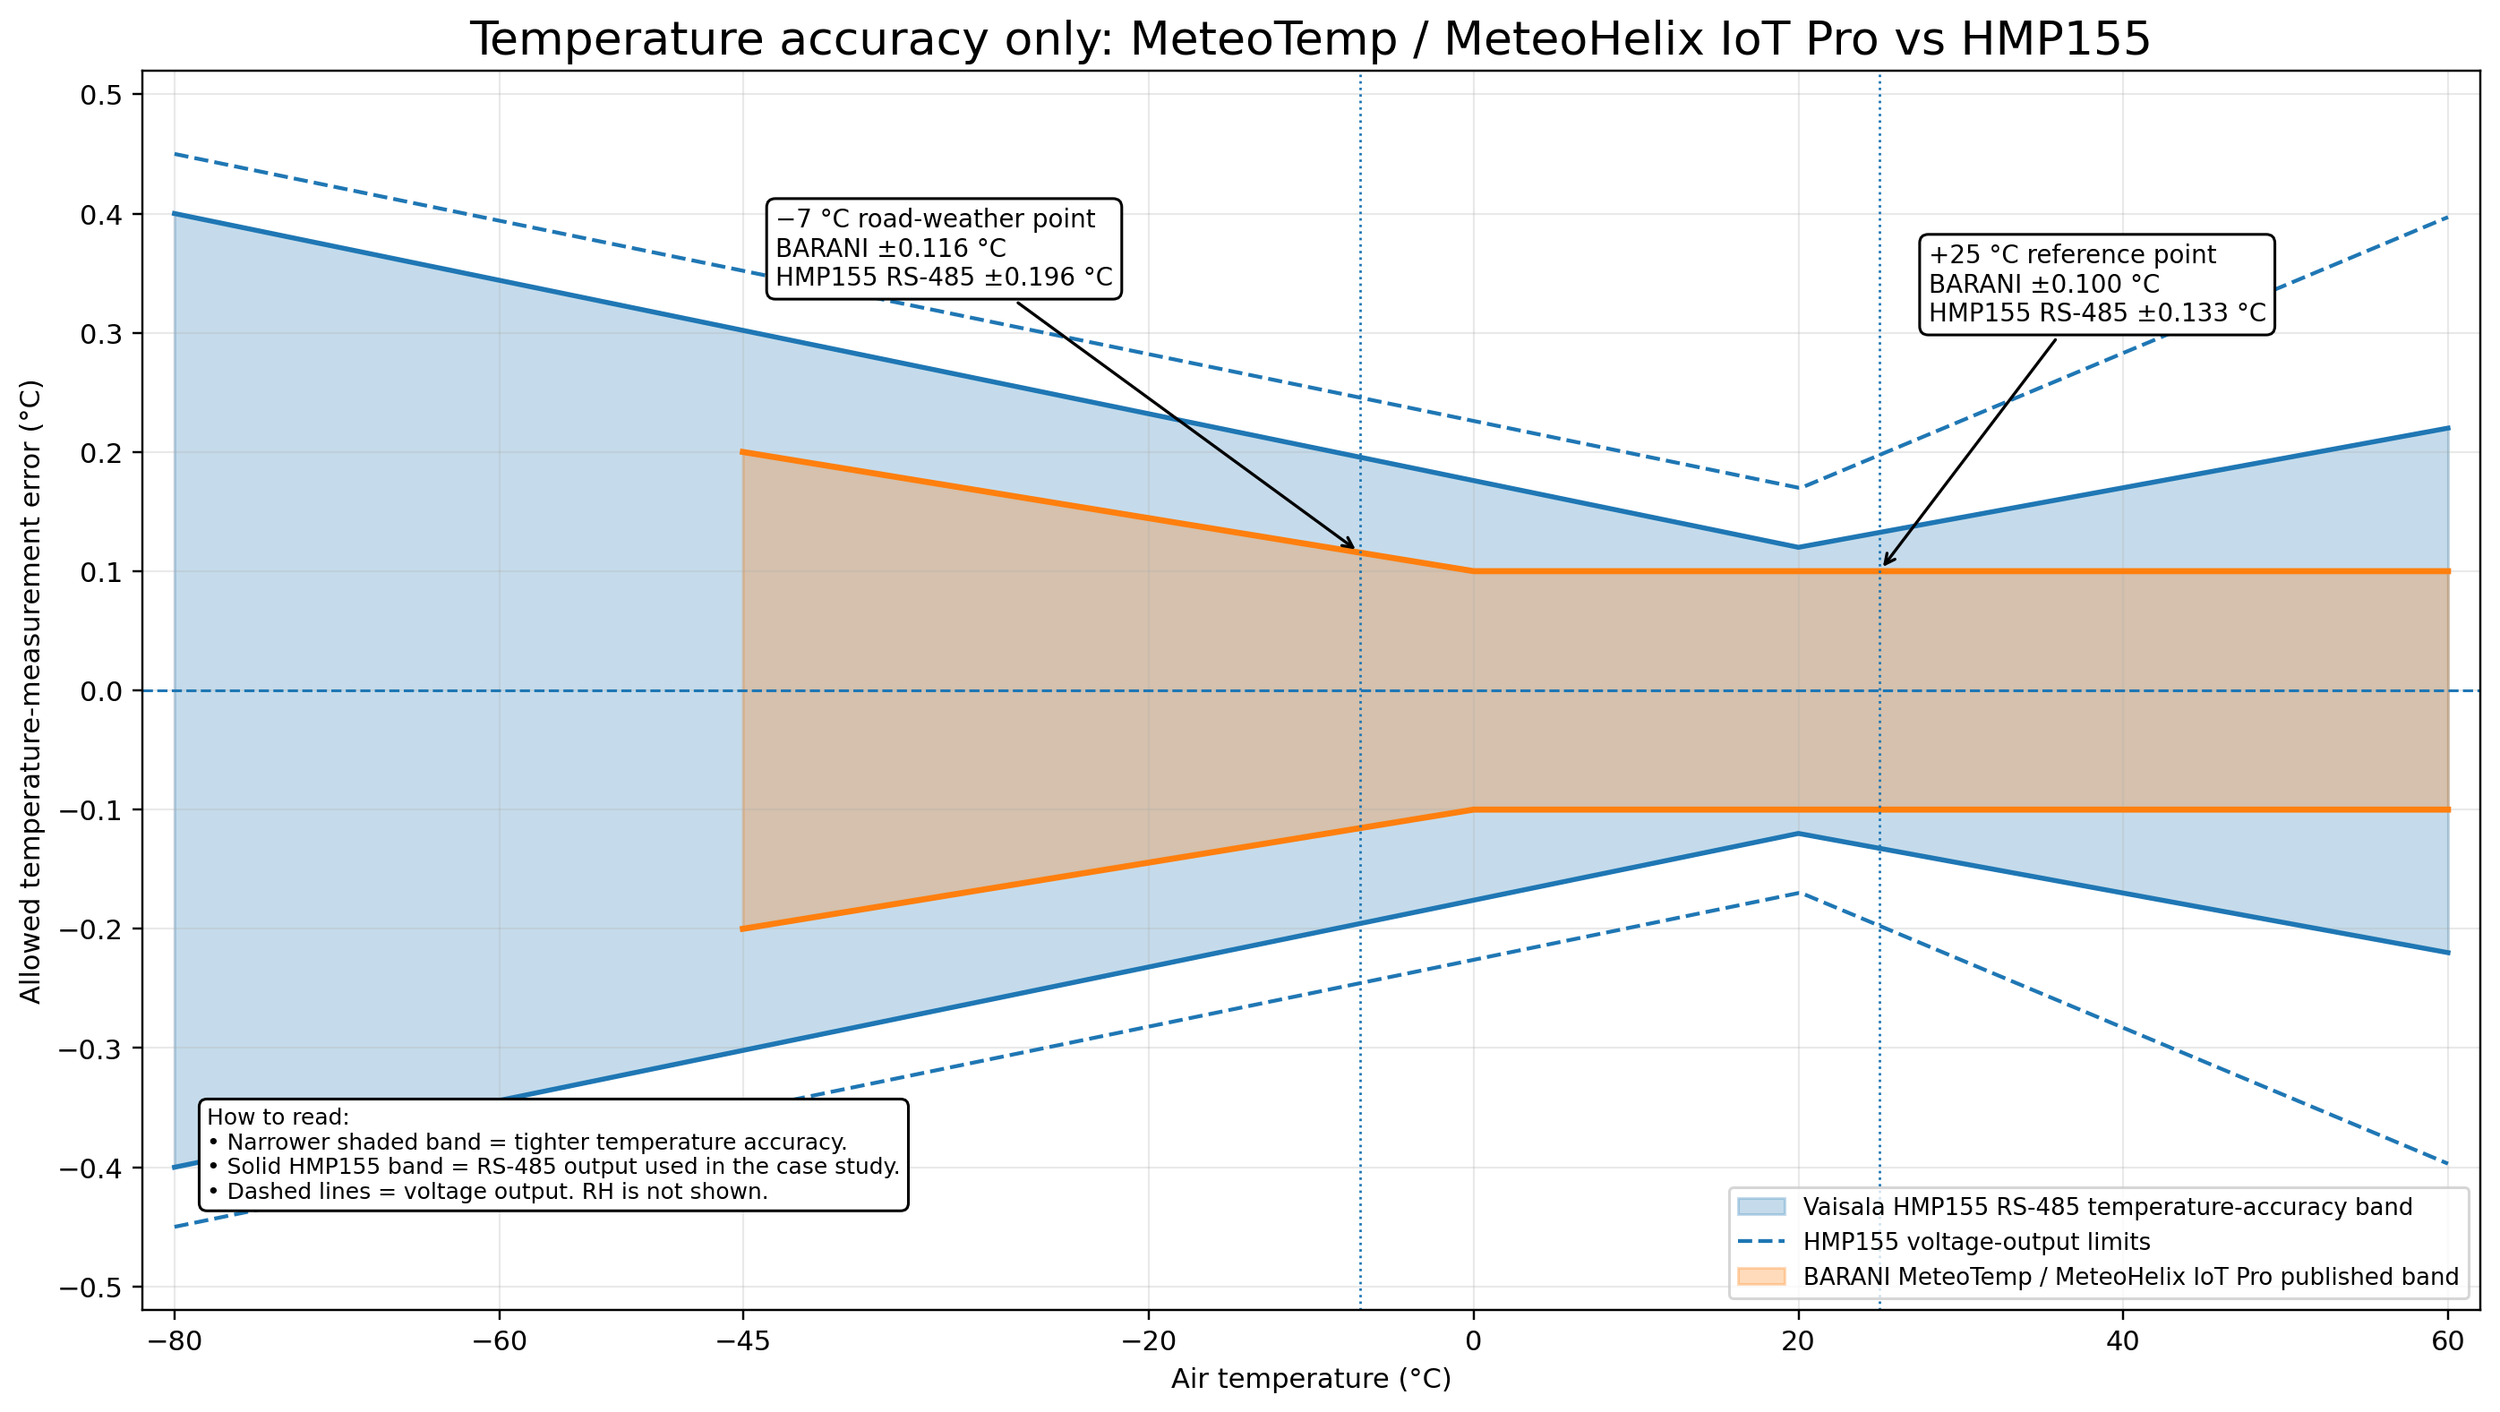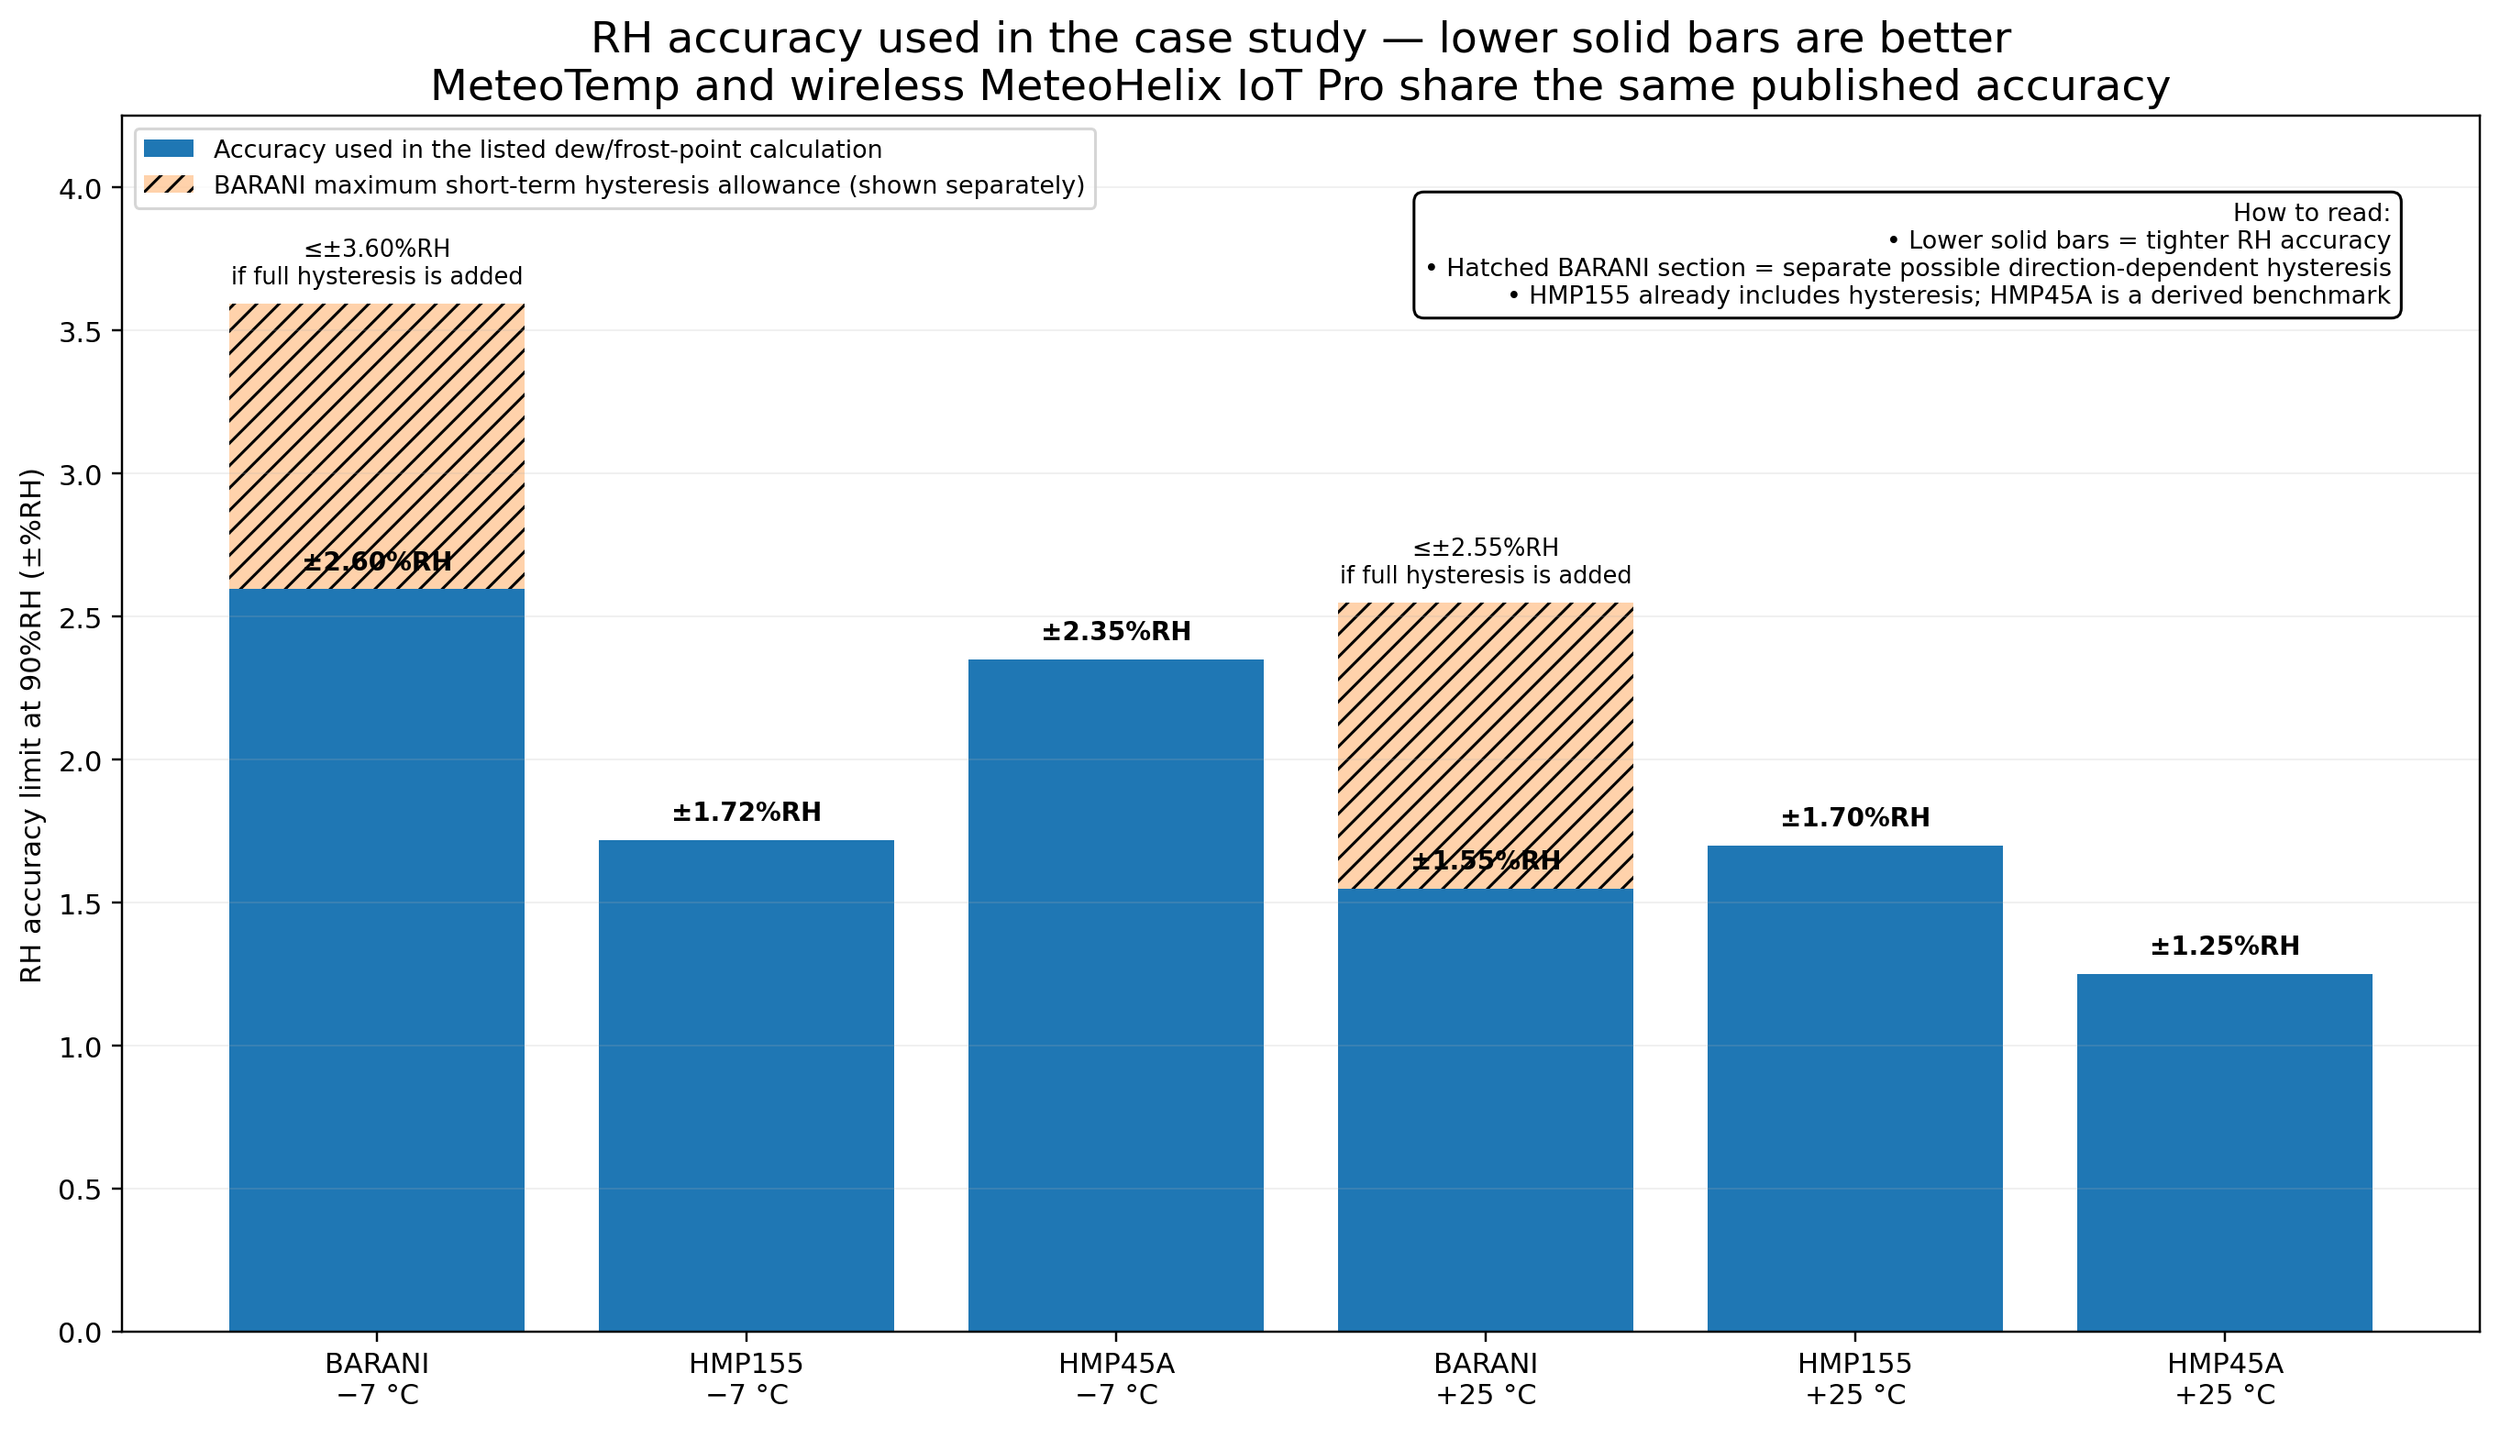

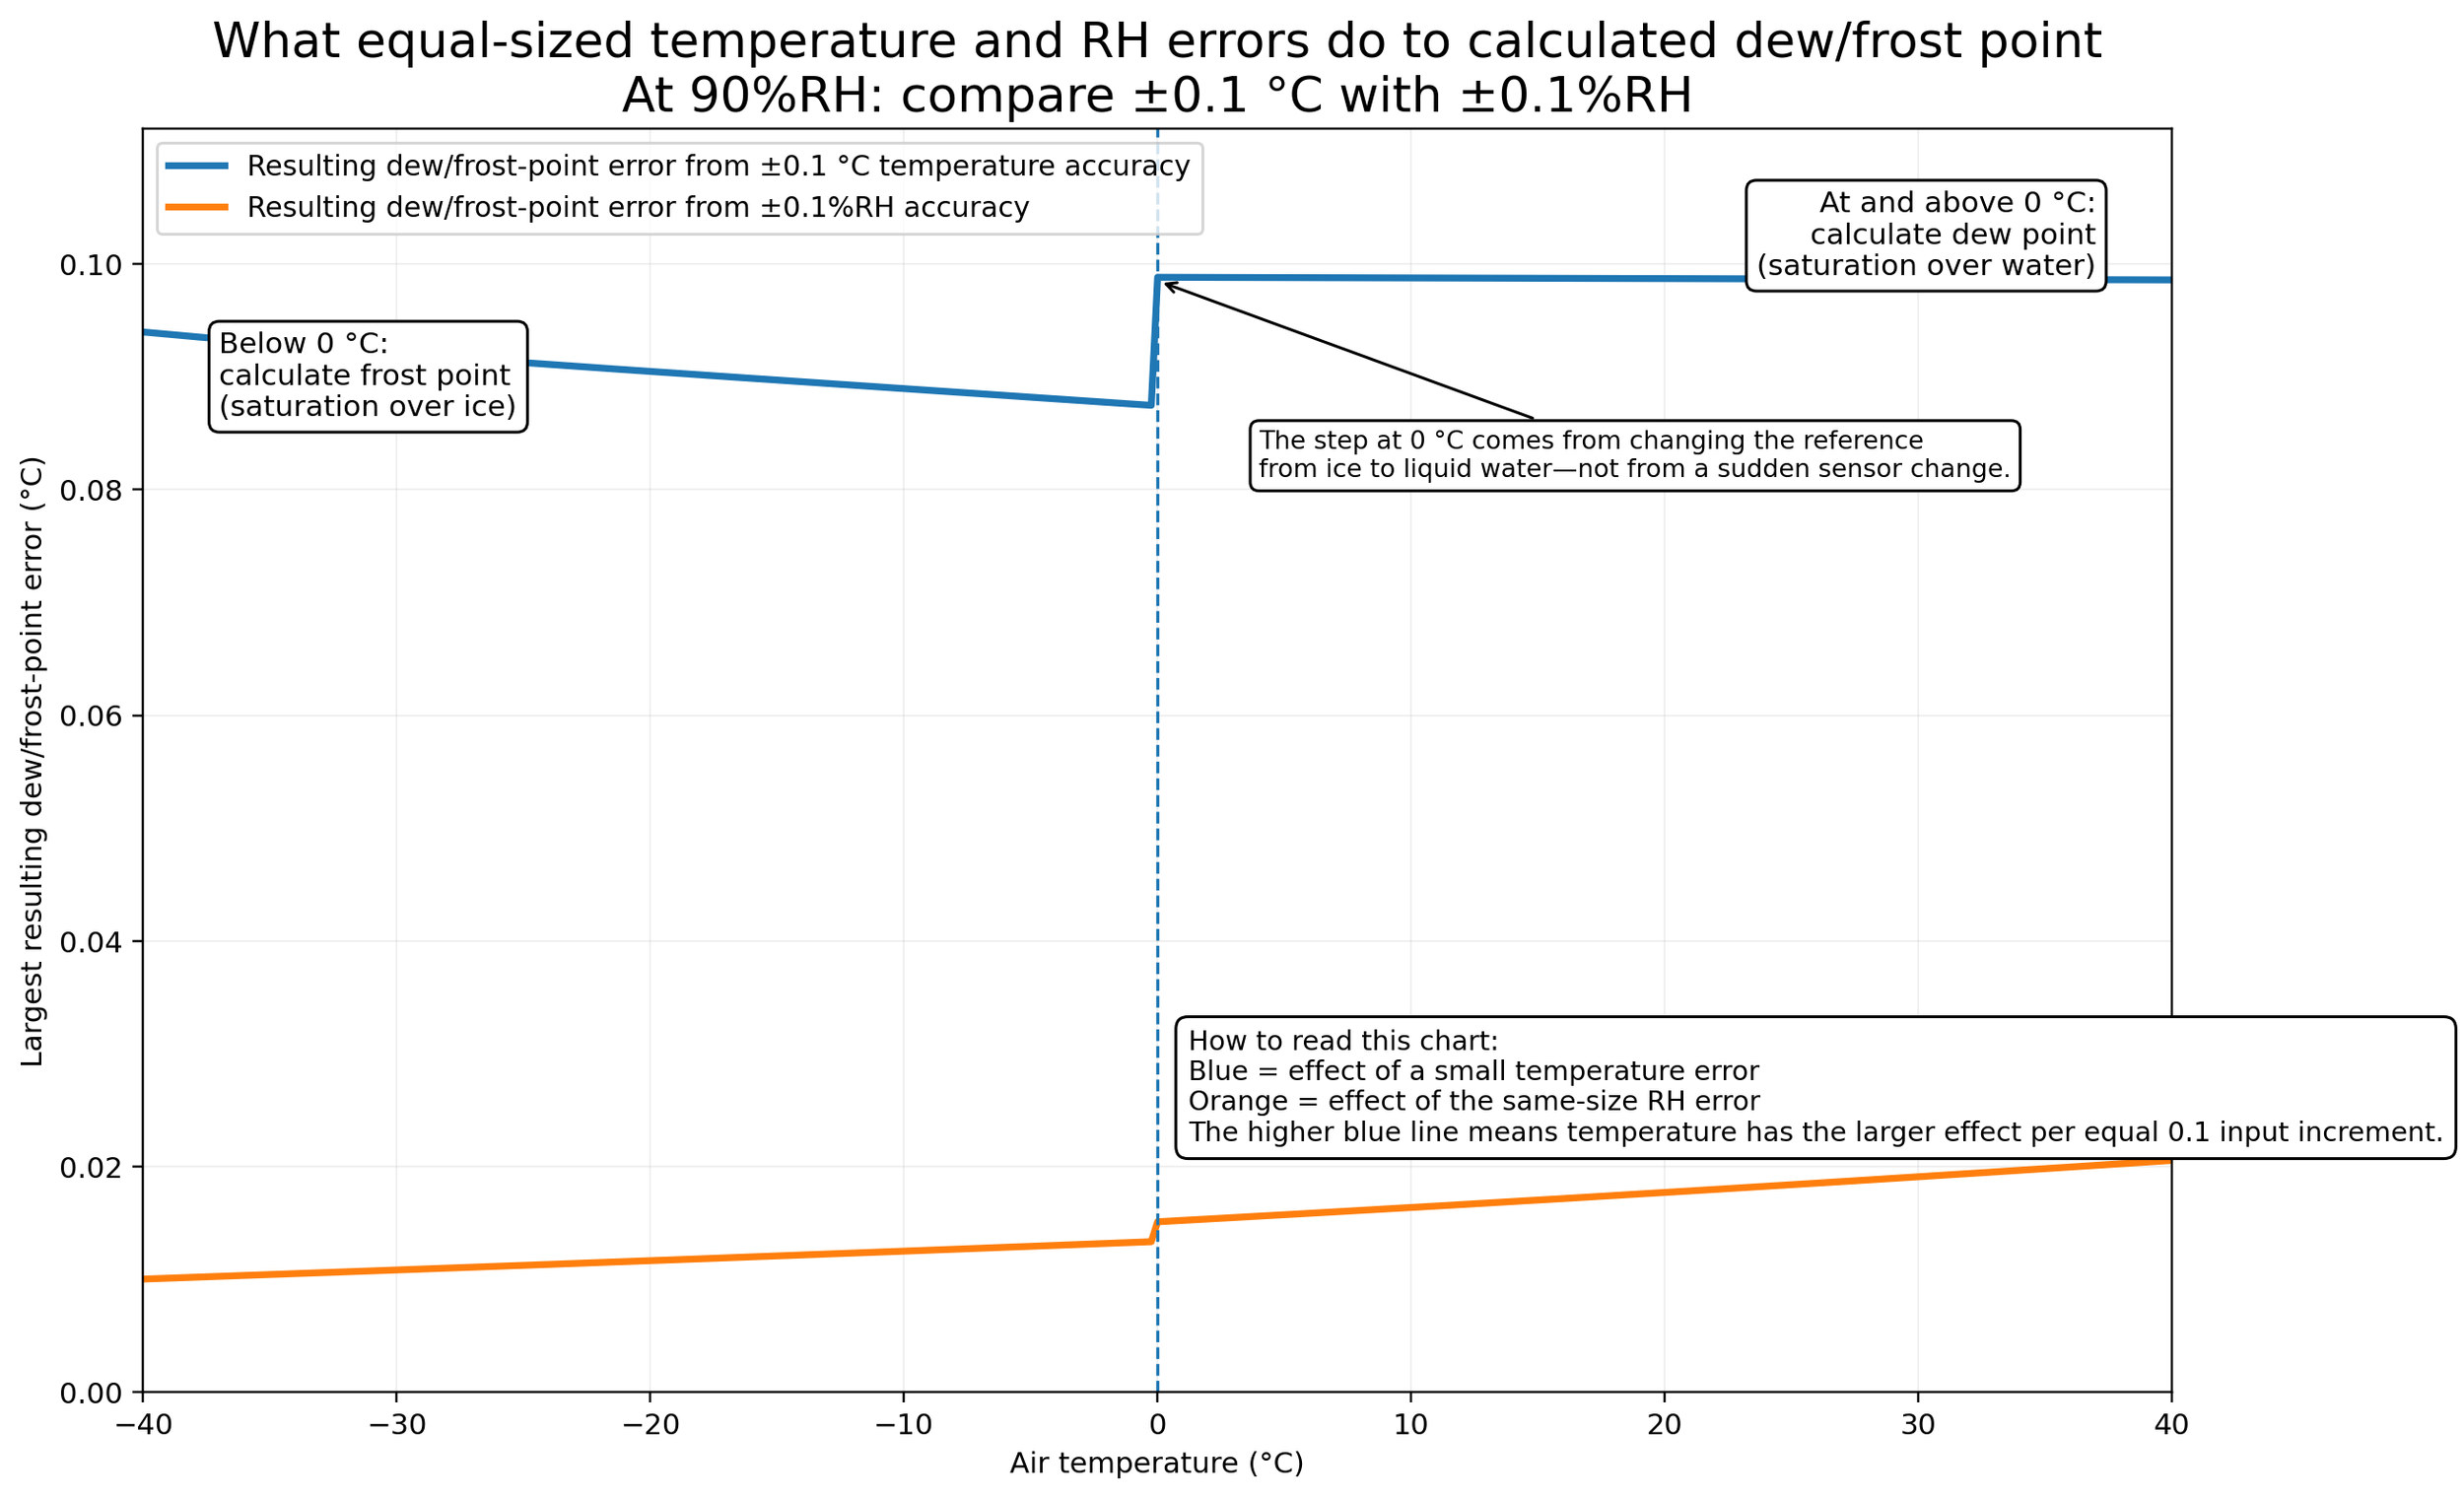
How to Minimize Dew Point Error: Temperature Accuracy vs. RH Accuracy
/
Combined effect of temperature and relative-humidity sensor accuracy on dew-point error at +50 °C and 90% RH. Select the sensor’s temperature accuracy on the horizontal axis and RH accuracy on the vertical axis. The color where the two values meet shows the resulting combined dew-point error: greener bands indicate lower error and redder bands indicate higher error.
Combined effect of temperature and relative-humidity sensor accuracy on dew-point error at +40 °C and 90% RH. Select the sensor’s temperature accuracy on the horizontal axis and RH accuracy on the vertical axis. The color where the two values meet shows the resulting combined dew-point error: greener bands indicate lower error and redder bands indicate higher error.
Combined effect of temperature and relative-humidity sensor accuracy on dew-point error at +30 °C and 90% RH. Select the sensor’s temperature accuracy on the horizontal axis and RH accuracy on the vertical axis. The color where the two values meet shows the resulting combined dew-point error: greener bands indicate lower error and redder bands indicate higher error.
Combined effect of temperature and relative-humidity sensor accuracy on dew-point error at +20 °C and 90% RH. Select the sensor’s temperature accuracy on the horizontal axis and RH accuracy on the vertical axis. The color where the two values meet shows the resulting combined dew-point error: greener bands indicate lower error and redder bands indicate higher error.
Combined effect of temperature and relative-humidity sensor accuracy on dew-point error at +10 °C and 90% RH. Select the sensor’s temperature accuracy on the horizontal axis and RH accuracy on the vertical axis. The color where the two values meet shows the resulting combined dew-point error: greener bands indicate lower error and redder bands indicate higher error.
Combined effect of temperature and relative-humidity sensor accuracy on dew-point error at 0 °C and 90% RH using the liquid-water convention. Select the sensor’s temperature accuracy on the horizontal axis and RH accuracy on the vertical axis. The color where the two values meet shows the resulting combined dew-point error: greener bands indicate lower error and redder bands indicate higher error.
Combined effect of temperature and relative-humidity sensor accuracy on frost-point error at 0 °C and 90% RH using the ice-side convention. Select the sensor’s temperature accuracy on the horizontal axis and RH accuracy on the vertical axis. The color where the two values meet shows the resulting combined frost-point error: greener bands indicate lower error and redder bands indicate higher error.
Practical NaCl road-salt operating landmark. Combined effect of temperature and relative-humidity sensor accuracy on frost-point error at −7 °C and 90%RH. Select the sensor’s temperature accuracy on the horizontal axis and its absolute RH-accuracy limit in ±%RH on the vertical axis. The color where the two values meet shows the resulting combined frost-point error: greener bands indicate lower error and redder bands indicate higher error.
Combined effect of temperature and relative-humidity sensor accuracy on frost-point error at −10 °C and 90% RH. Select the sensor’s temperature accuracy on the horizontal axis and RH accuracy on the vertical axis. The color where the two values meet shows the resulting combined frost-point error: greener bands indicate lower error and redder bands indicate higher error.
Combined effect of temperature and relative-humidity sensor accuracy on frost-point error at −20 °C and 90% RH. Select the sensor’s temperature accuracy on the horizontal axis and RH accuracy on the vertical axis. The color where the two values meet shows the resulting combined frost-point error: greener bands indicate lower error and redder bands indicate higher error.
Combined effect of temperature and relative-humidity sensor accuracy on frost-point error at −30 °C and 90% RH. Select the sensor’s temperature accuracy on the horizontal axis and RH accuracy on the vertical axis. The color where the two values meet shows the resulting combined frost-point error: greener bands indicate lower error and redder bands indicate higher error.
Combined effect of temperature and relative-humidity sensor accuracy on frost-point error at −40 °C and 90% RH. Select the sensor’s temperature accuracy on the horizontal axis and RH accuracy on the vertical axis. The color where the two values meet shows the resulting combined frost-point error: greener bands indicate lower error and redder bands indicate higher error.